
Contribution of Top and Bottom Devices to Efficiency in a Tandem QLED
Highlights
In this study, novel regular tandem QLEDs are demonstrated with an ultrathin (≈4 nm) indium tin oxide (ITO) charge generation layer (CGL). Through systematic optimization of charge injection balance and light out-coupling efficiency, the resulting tandem QLEDs can exhibit a record-breaking EQE of 51.2%, which represent the highest performance metrics reported to date for regular tandem QLEDs.
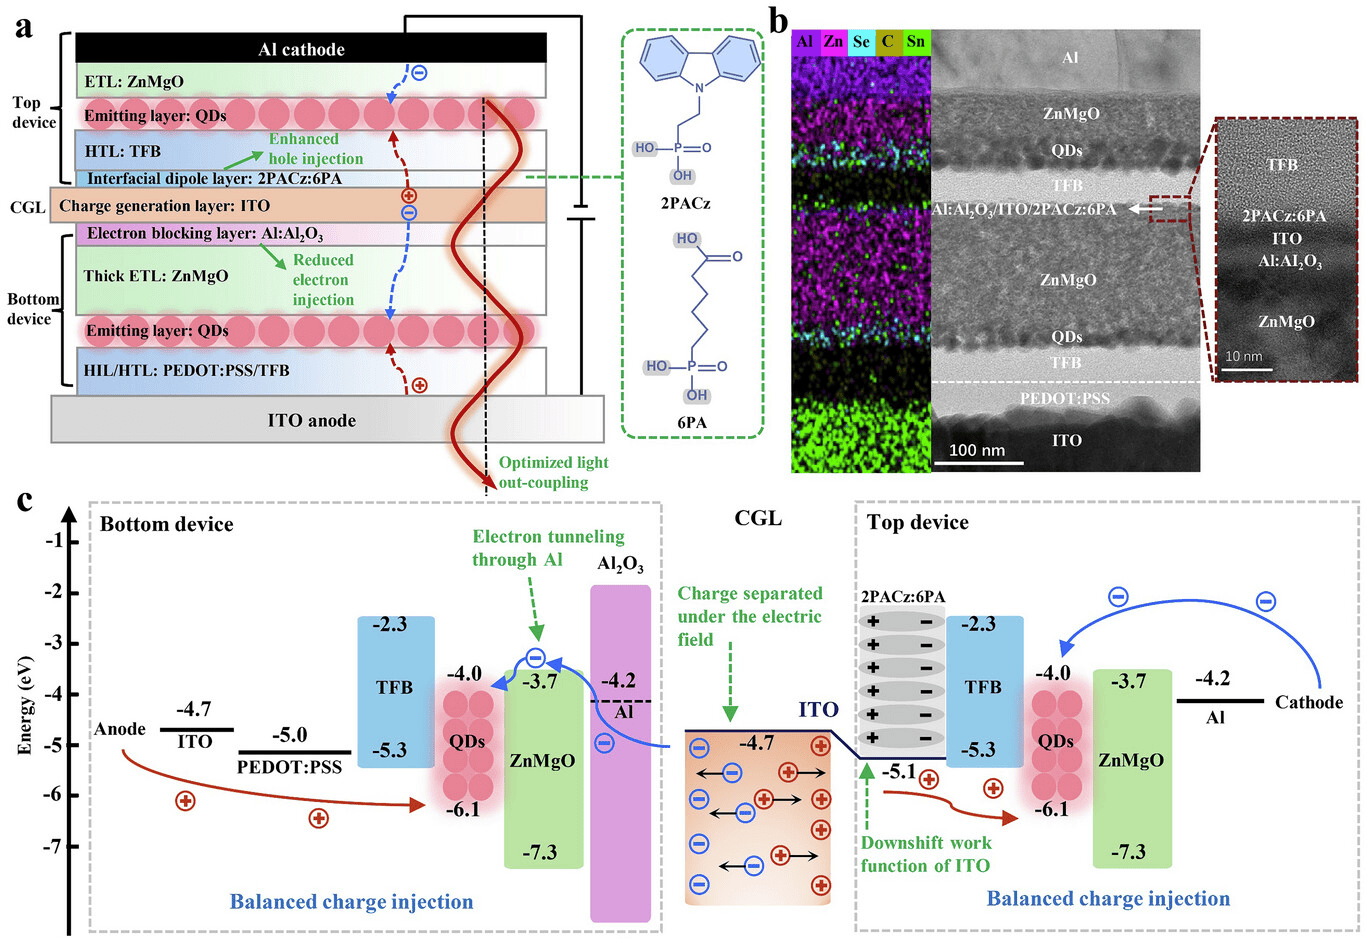
Figure 1. Device structure and working mechanism of regular tandem QLEDs. (a) Schematic device structure of regular tandem QLEDs. The inset on the right shows chemical structures of 2PACz and 6PA. (b) Cross-sectional TEM images and corresponding color-mixed EDS elemental mapping image of regular tandem QLEDs. (c) Working mechanism of regular tandem QLEDs.
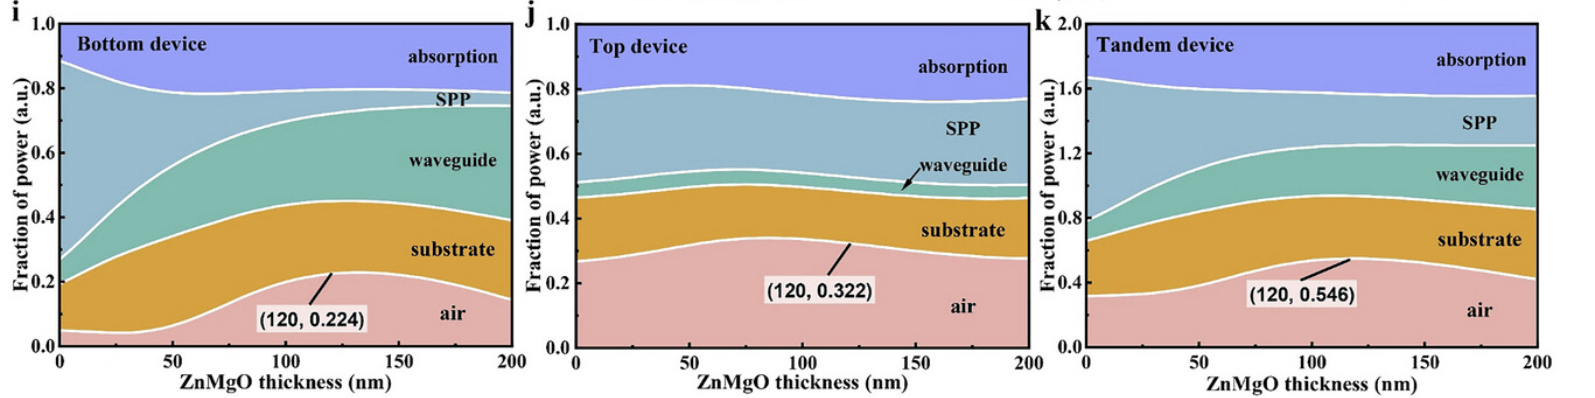
Figure 2. Calculated power fraction of (i) bottom device, (j) top device, and (k) tandem device.
Preparation
Install and activate Leda according to the Installation and Licensing guide.
The authors provided the refractive index data of the materials in the Supporting Information.
The refractive indices of each layer in the tandem QLED structure at the target wavelength of 632 nm are as follows:
- ITO: 1.73+0.01i
- PEDOT:PSS: 1.48
- TFB: 1.72
- QDs: 1.95
- ZnMgO: 1.59
- Al2O3: 1.37+7.52i
- 2PACz:6PA: 1.72
- Al: 1.37+7.52i
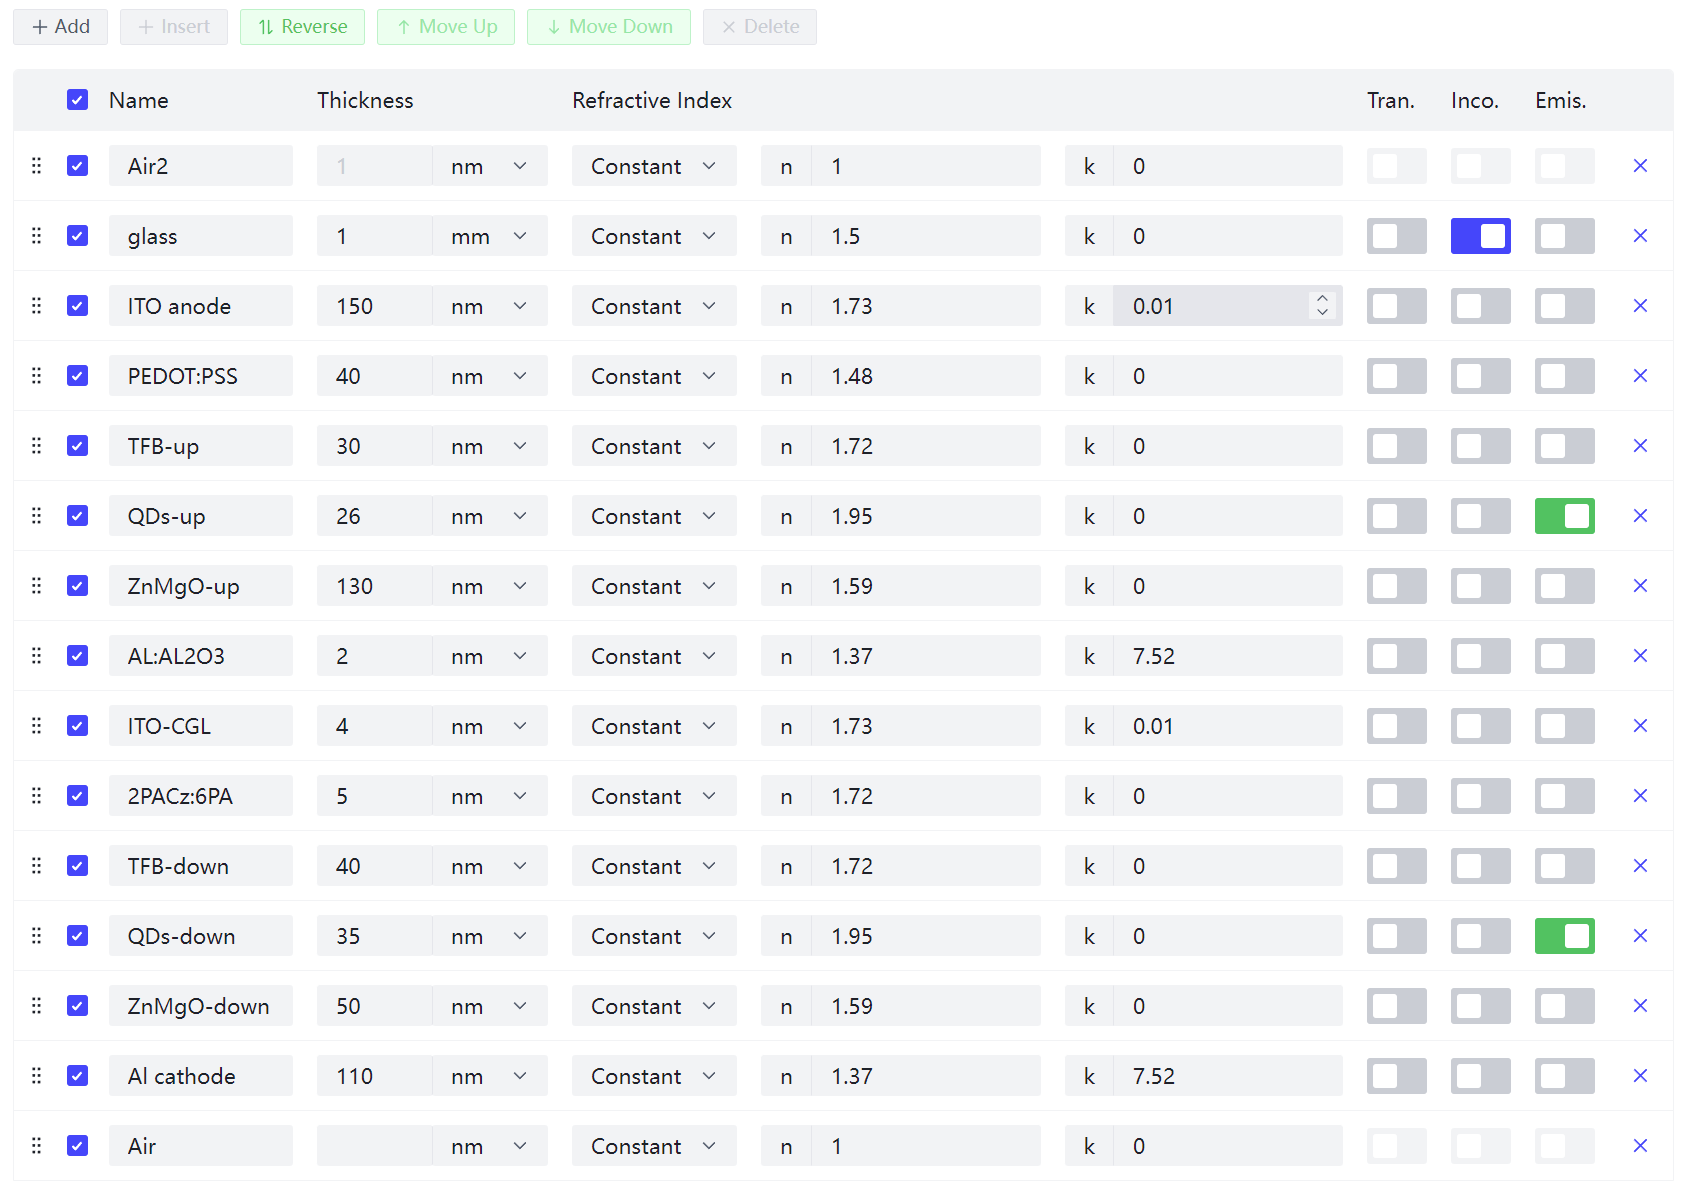
The device structure in the paper is: glass/ITO anode (150 nm)/PEDOT:PSS (40 nm)/TFB-up (30 nm)/QDs-up (26 nm)/ZnMgO-up (130 nm)/Al:Al2O3 (2 nm)/ITO-CGL (4 nm)/2PACz:6PA (5 nm)/TFB-down (40 nm)/QDs-down (35 nm)/ZnMgO-down (50 nm)/Al cathode (110 nm)
The data is for this case study only. If you use this data in a real project, please cite: Yang et al., 2025
Regular Tandem Device
First, build the regular tandem QLED structure according to Figure 1(a), importing the thickness and refractive index data provided by the authors for each layer. Note that this structure emits light from the ITO anode side. When building the model, the emitting side should face upwards, which is the reverse of the order shown in Figure 1(a). The ITO anode is at the top, and the Al cathode is at the bottom.
Activate the Emis. property for both QDs-up and QDs-down. Since the substrate is 1 mm thick glass, activate the Inco. property for the glass layer.
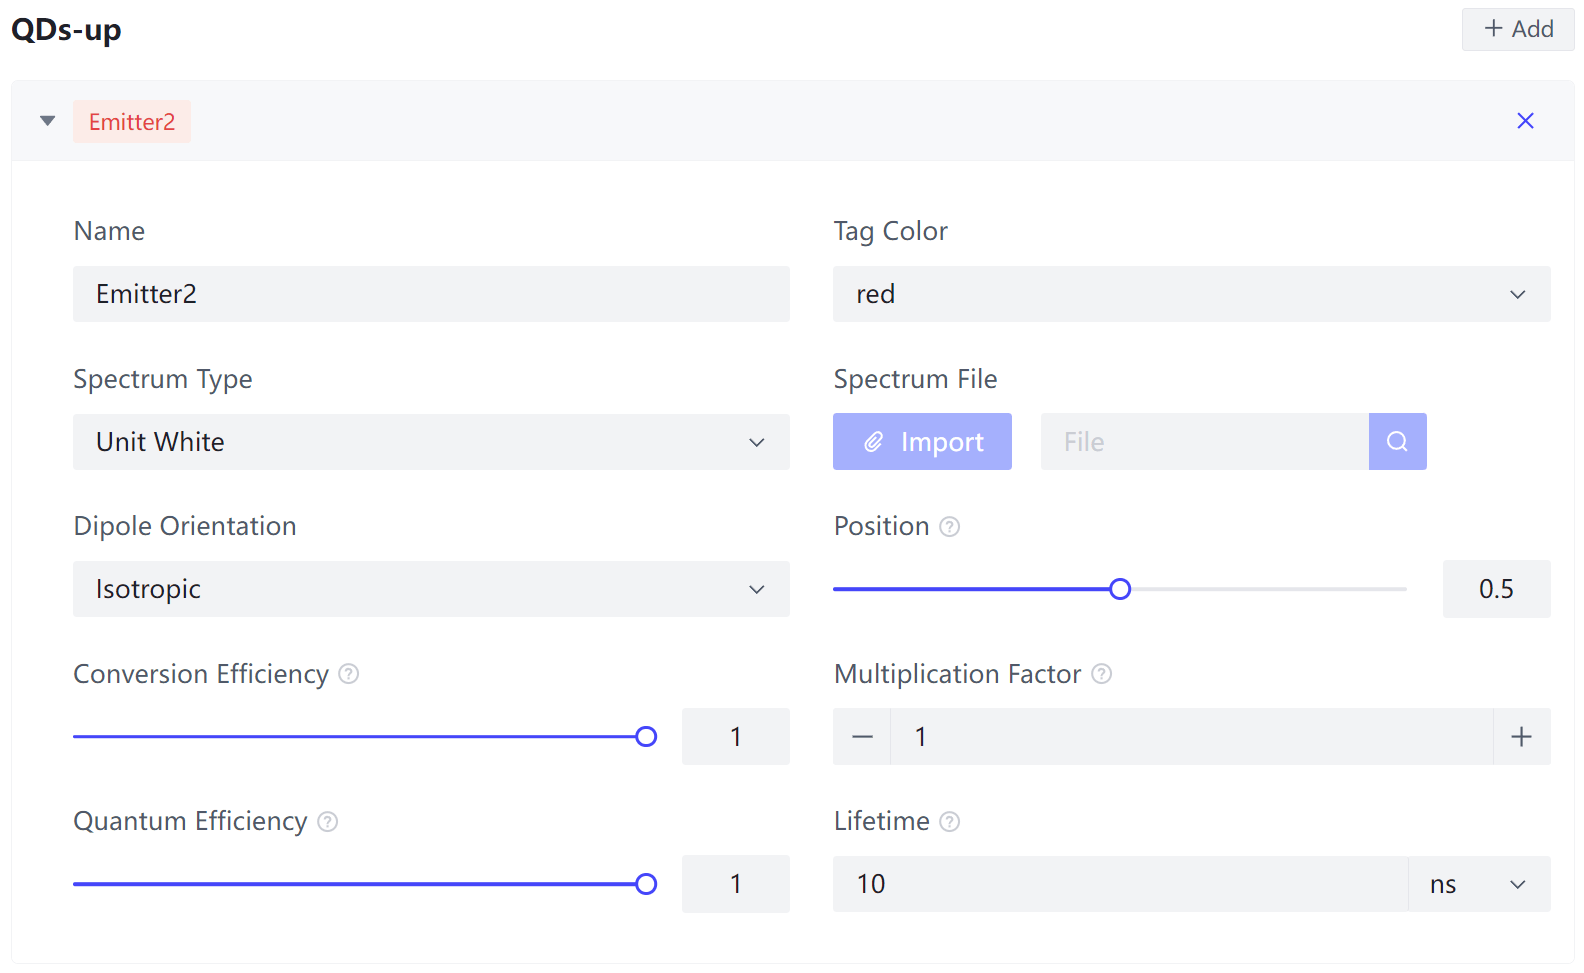
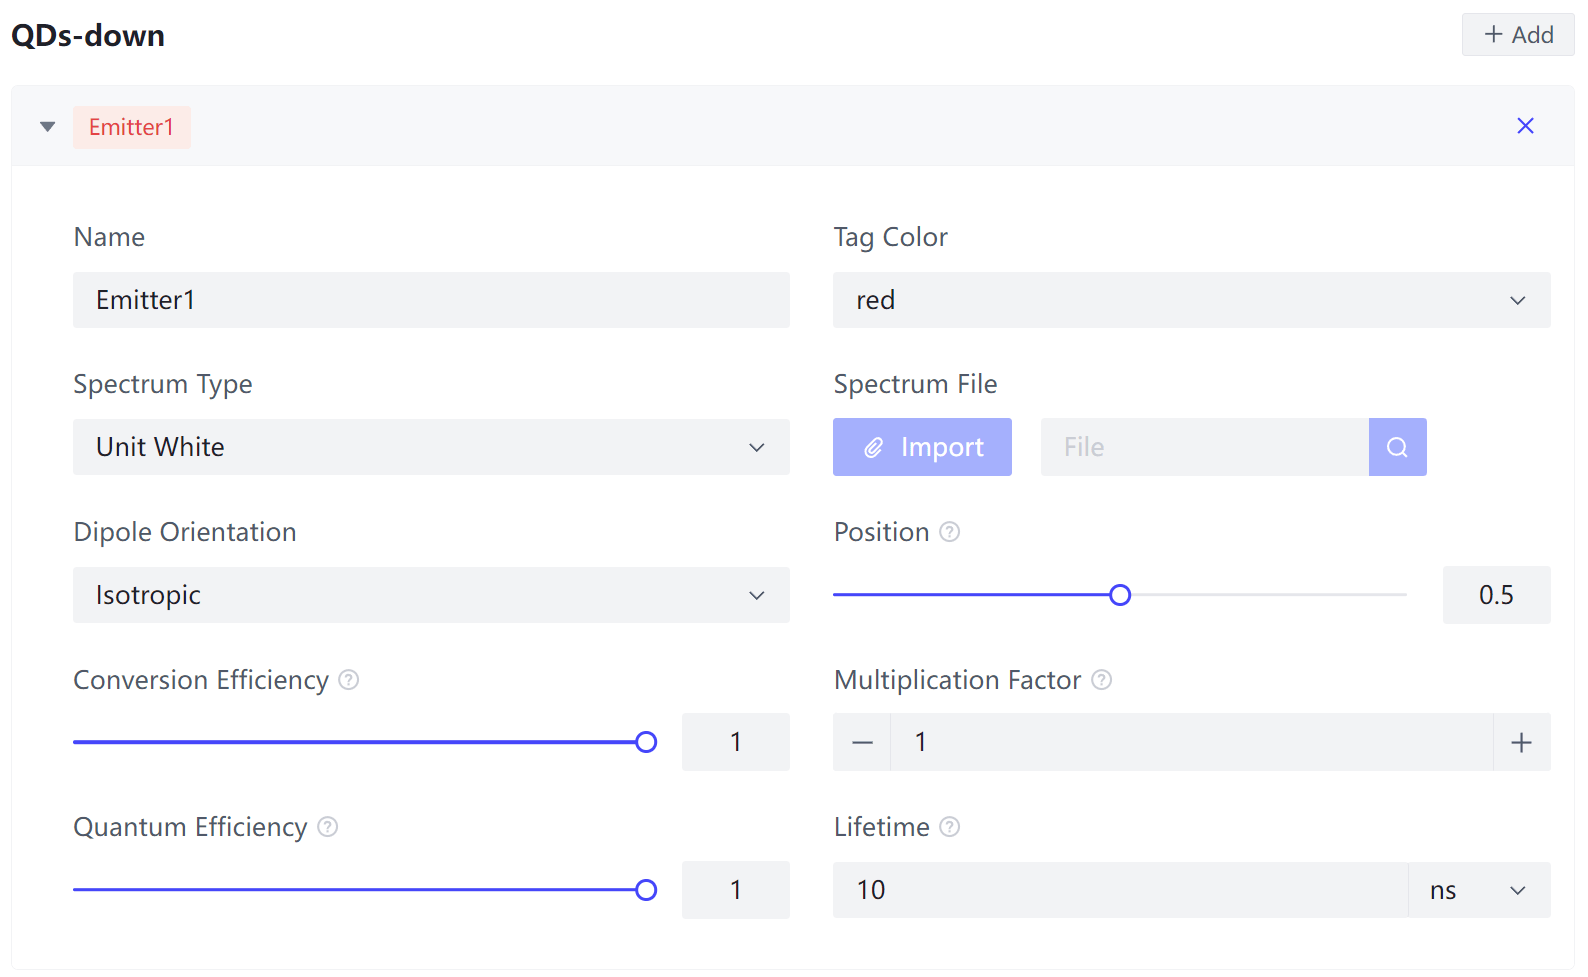
Since we are only investigating the device performance at the target wavelength of 632 nm, set the spectral type of both emitters to Unit White in the Emitter configuration page.
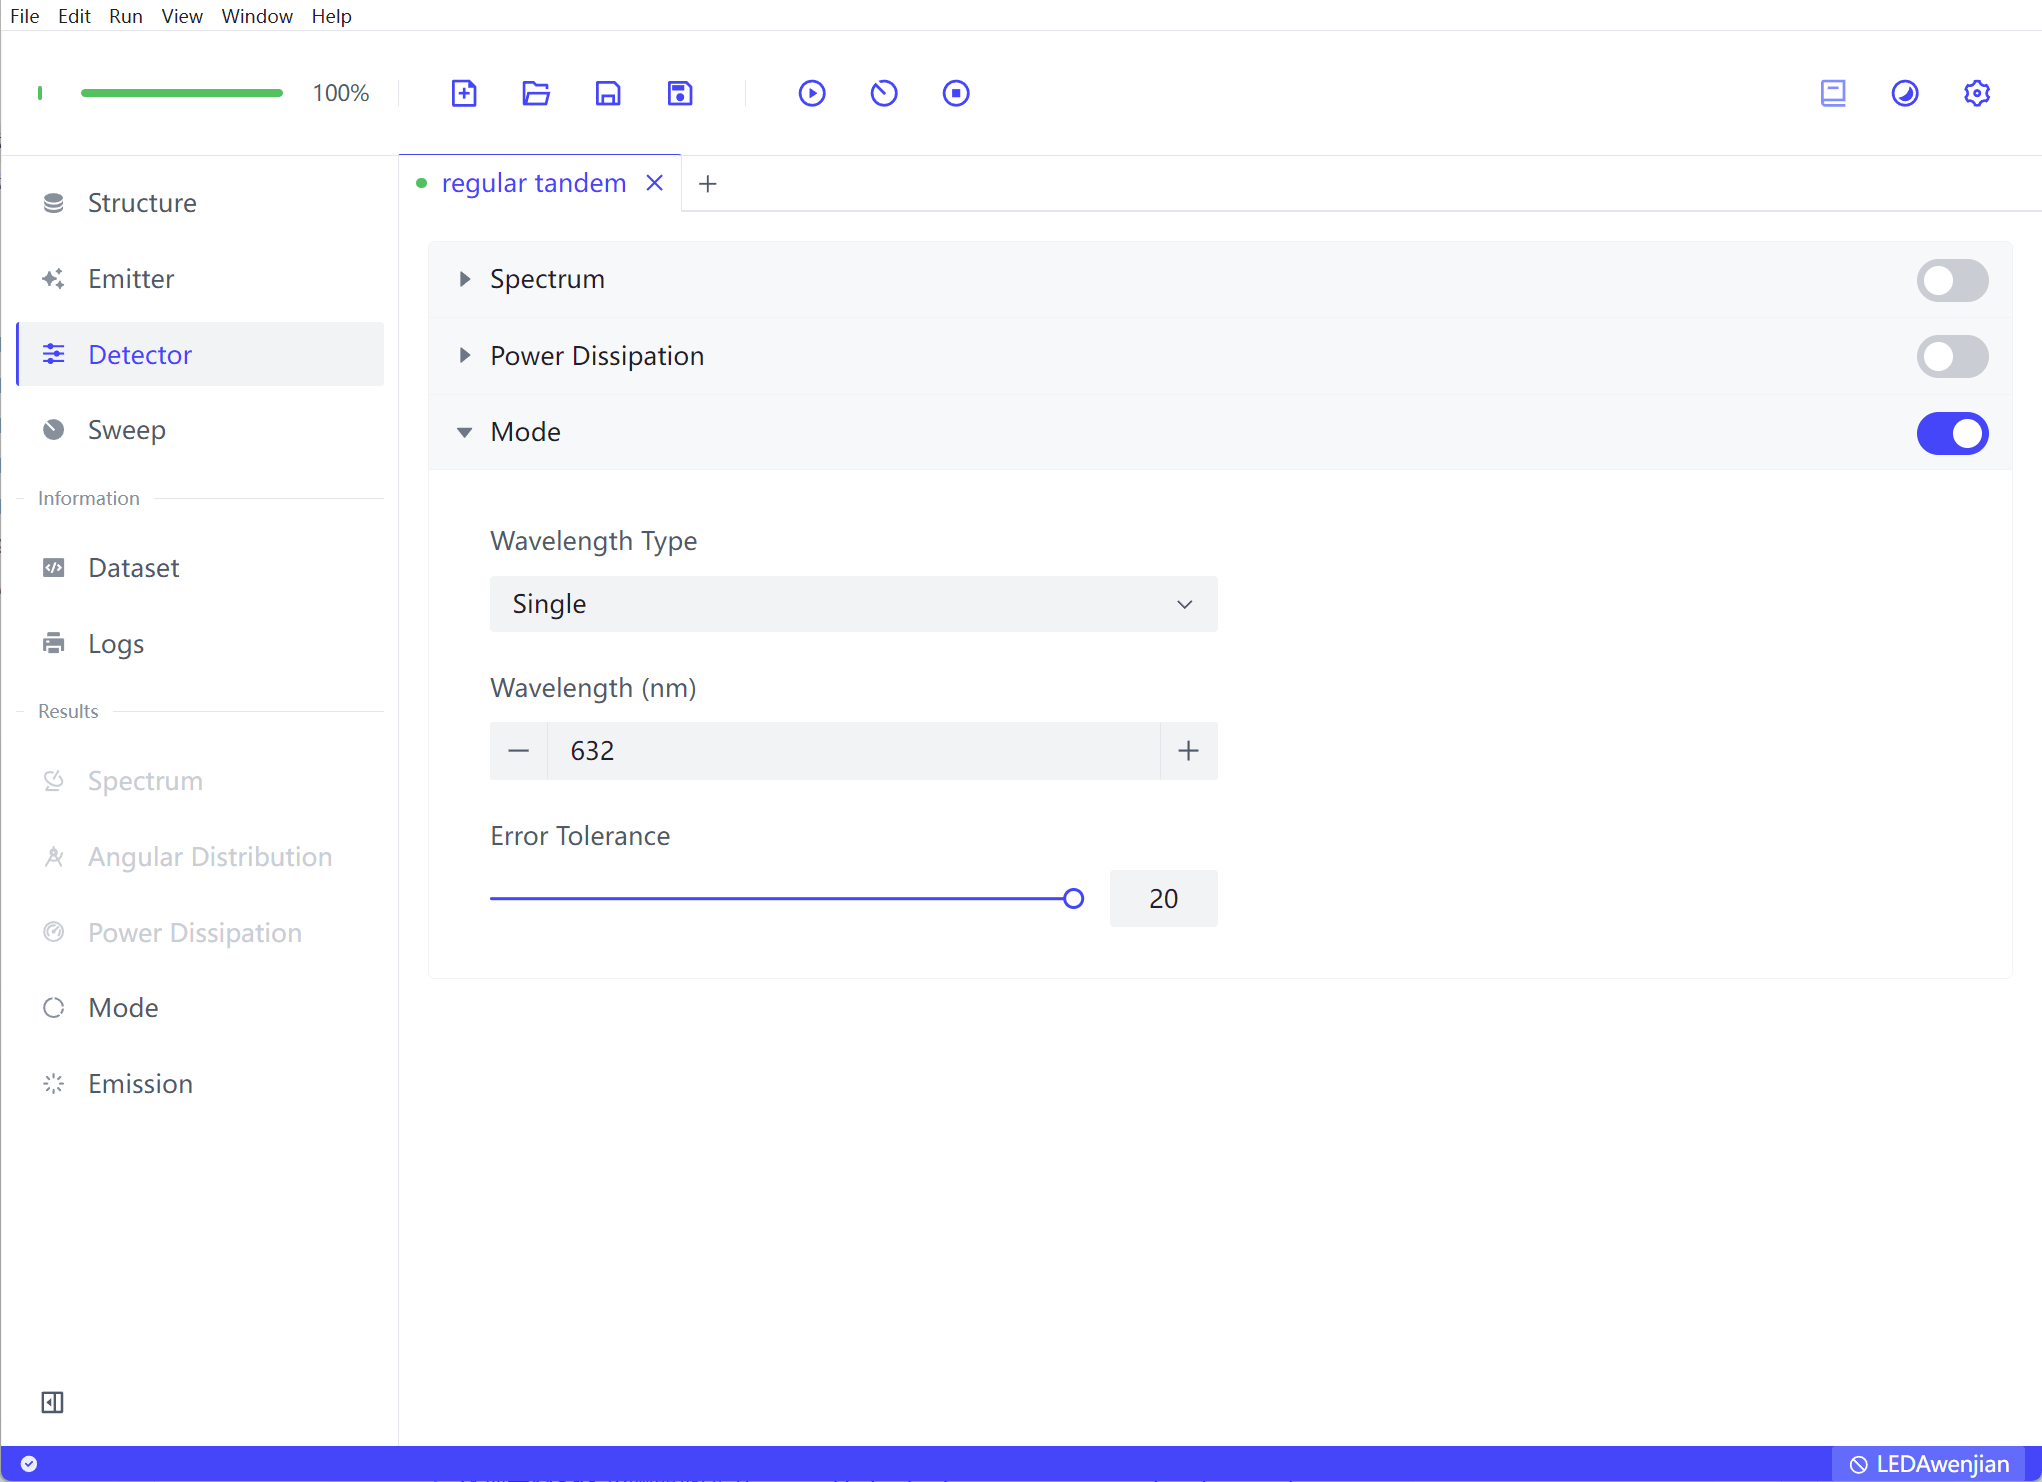
Enable the Mode Detector, set Wavelength Type to Single, and the wavelength to 632 nm. Increase the Error Tolerance to 20 to allow for some deviation.
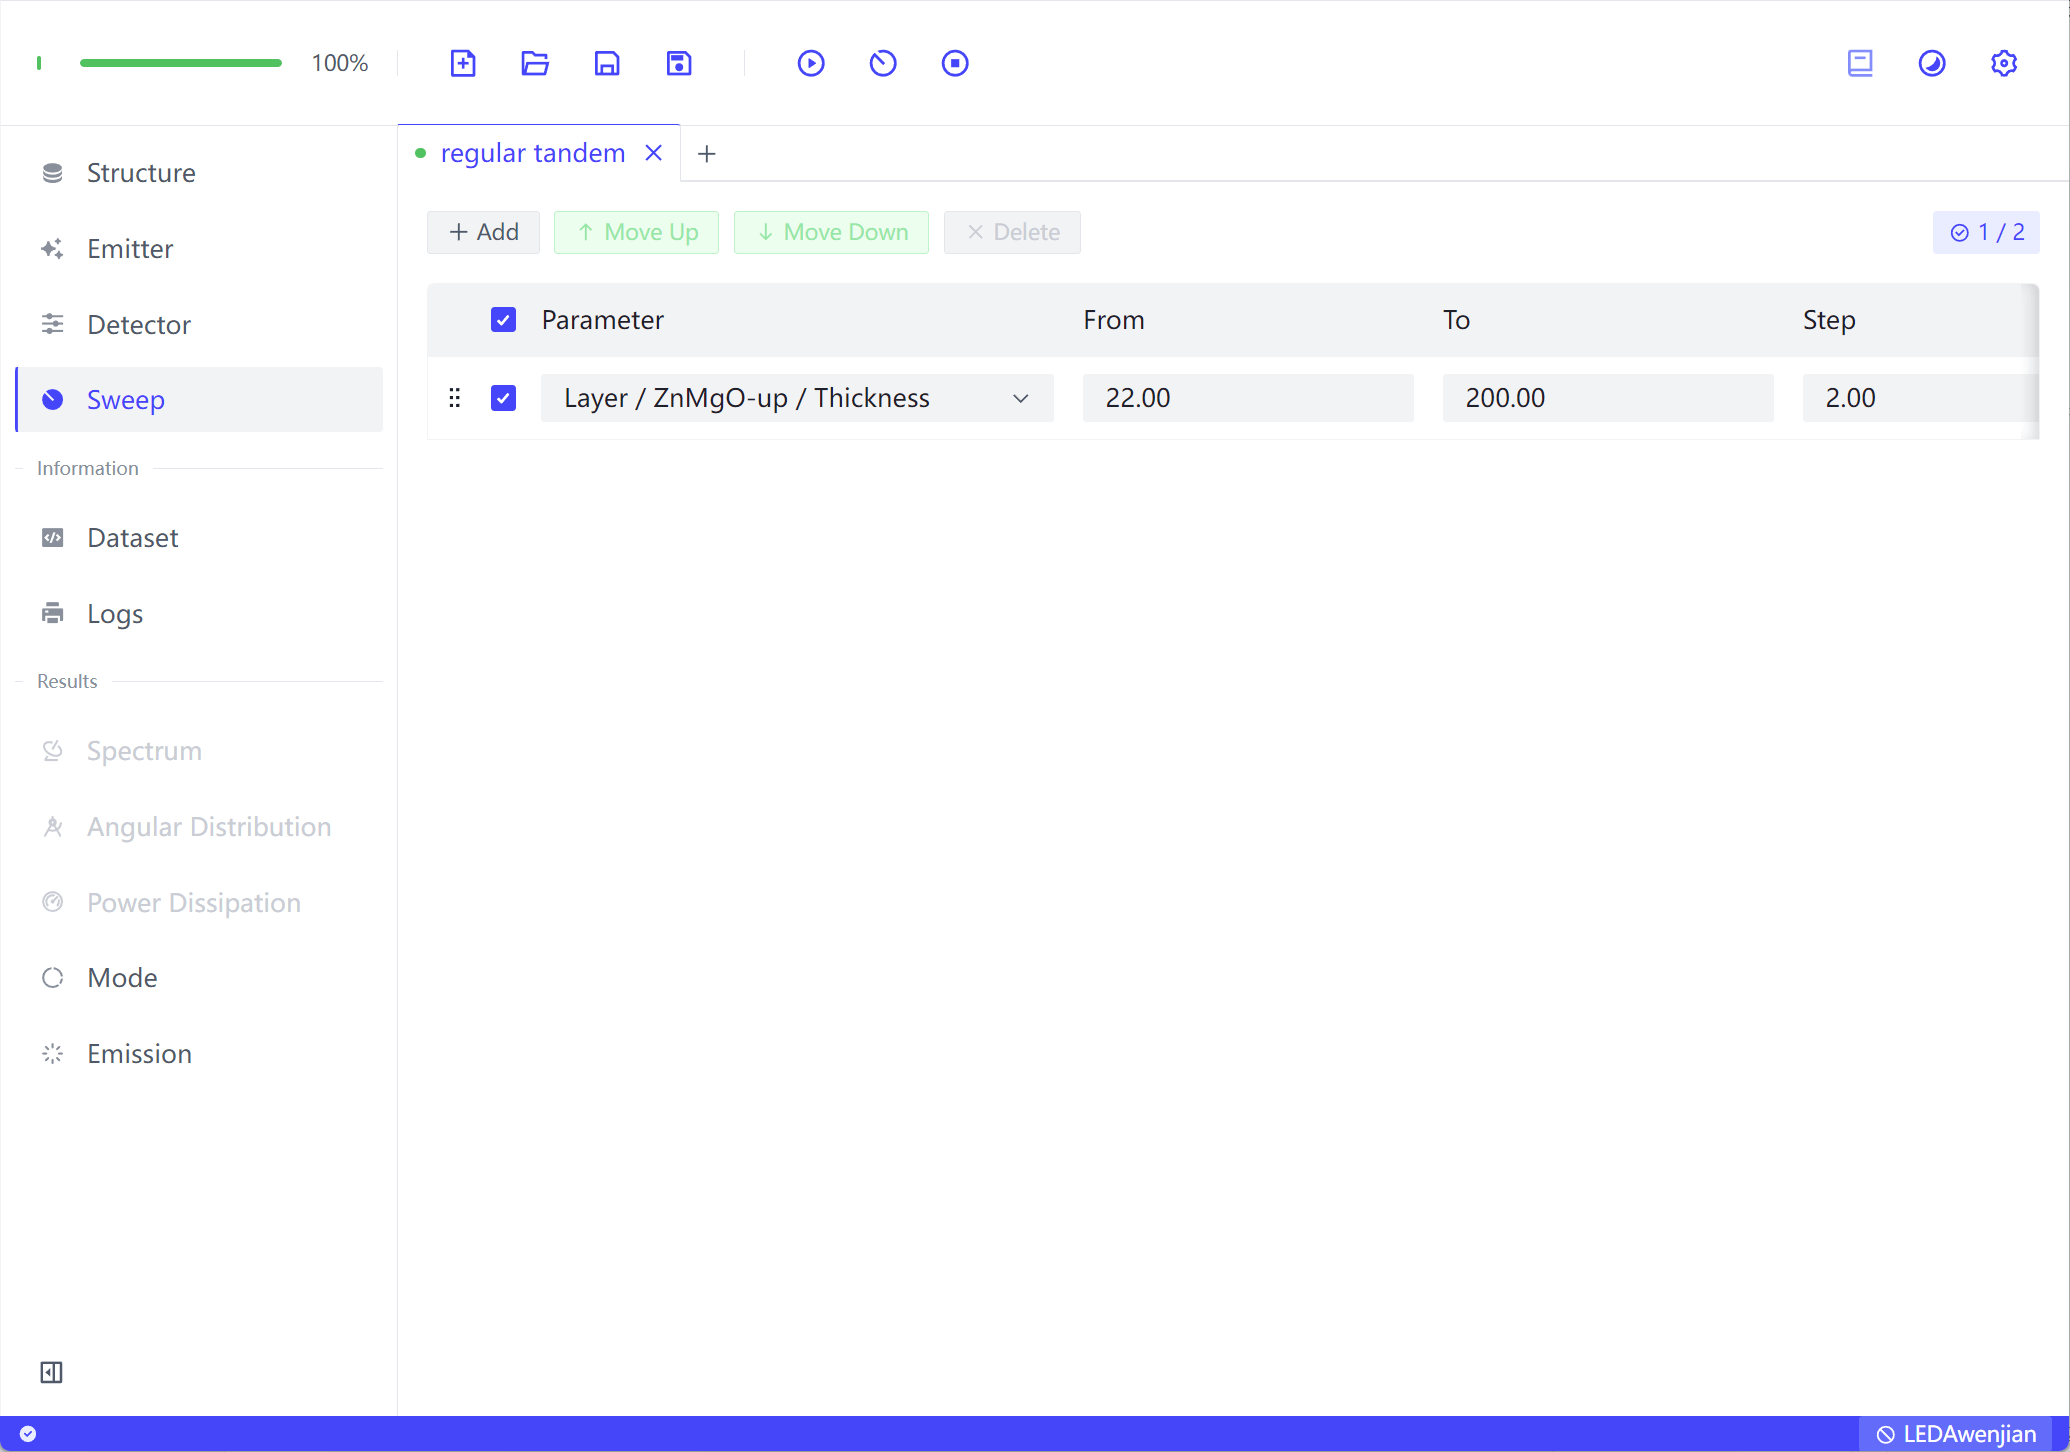
In Sweep, add a thickness scan for the ZnMgO-up layer, with a range from 22 nm to 200 nm and a step size of 2 nm.
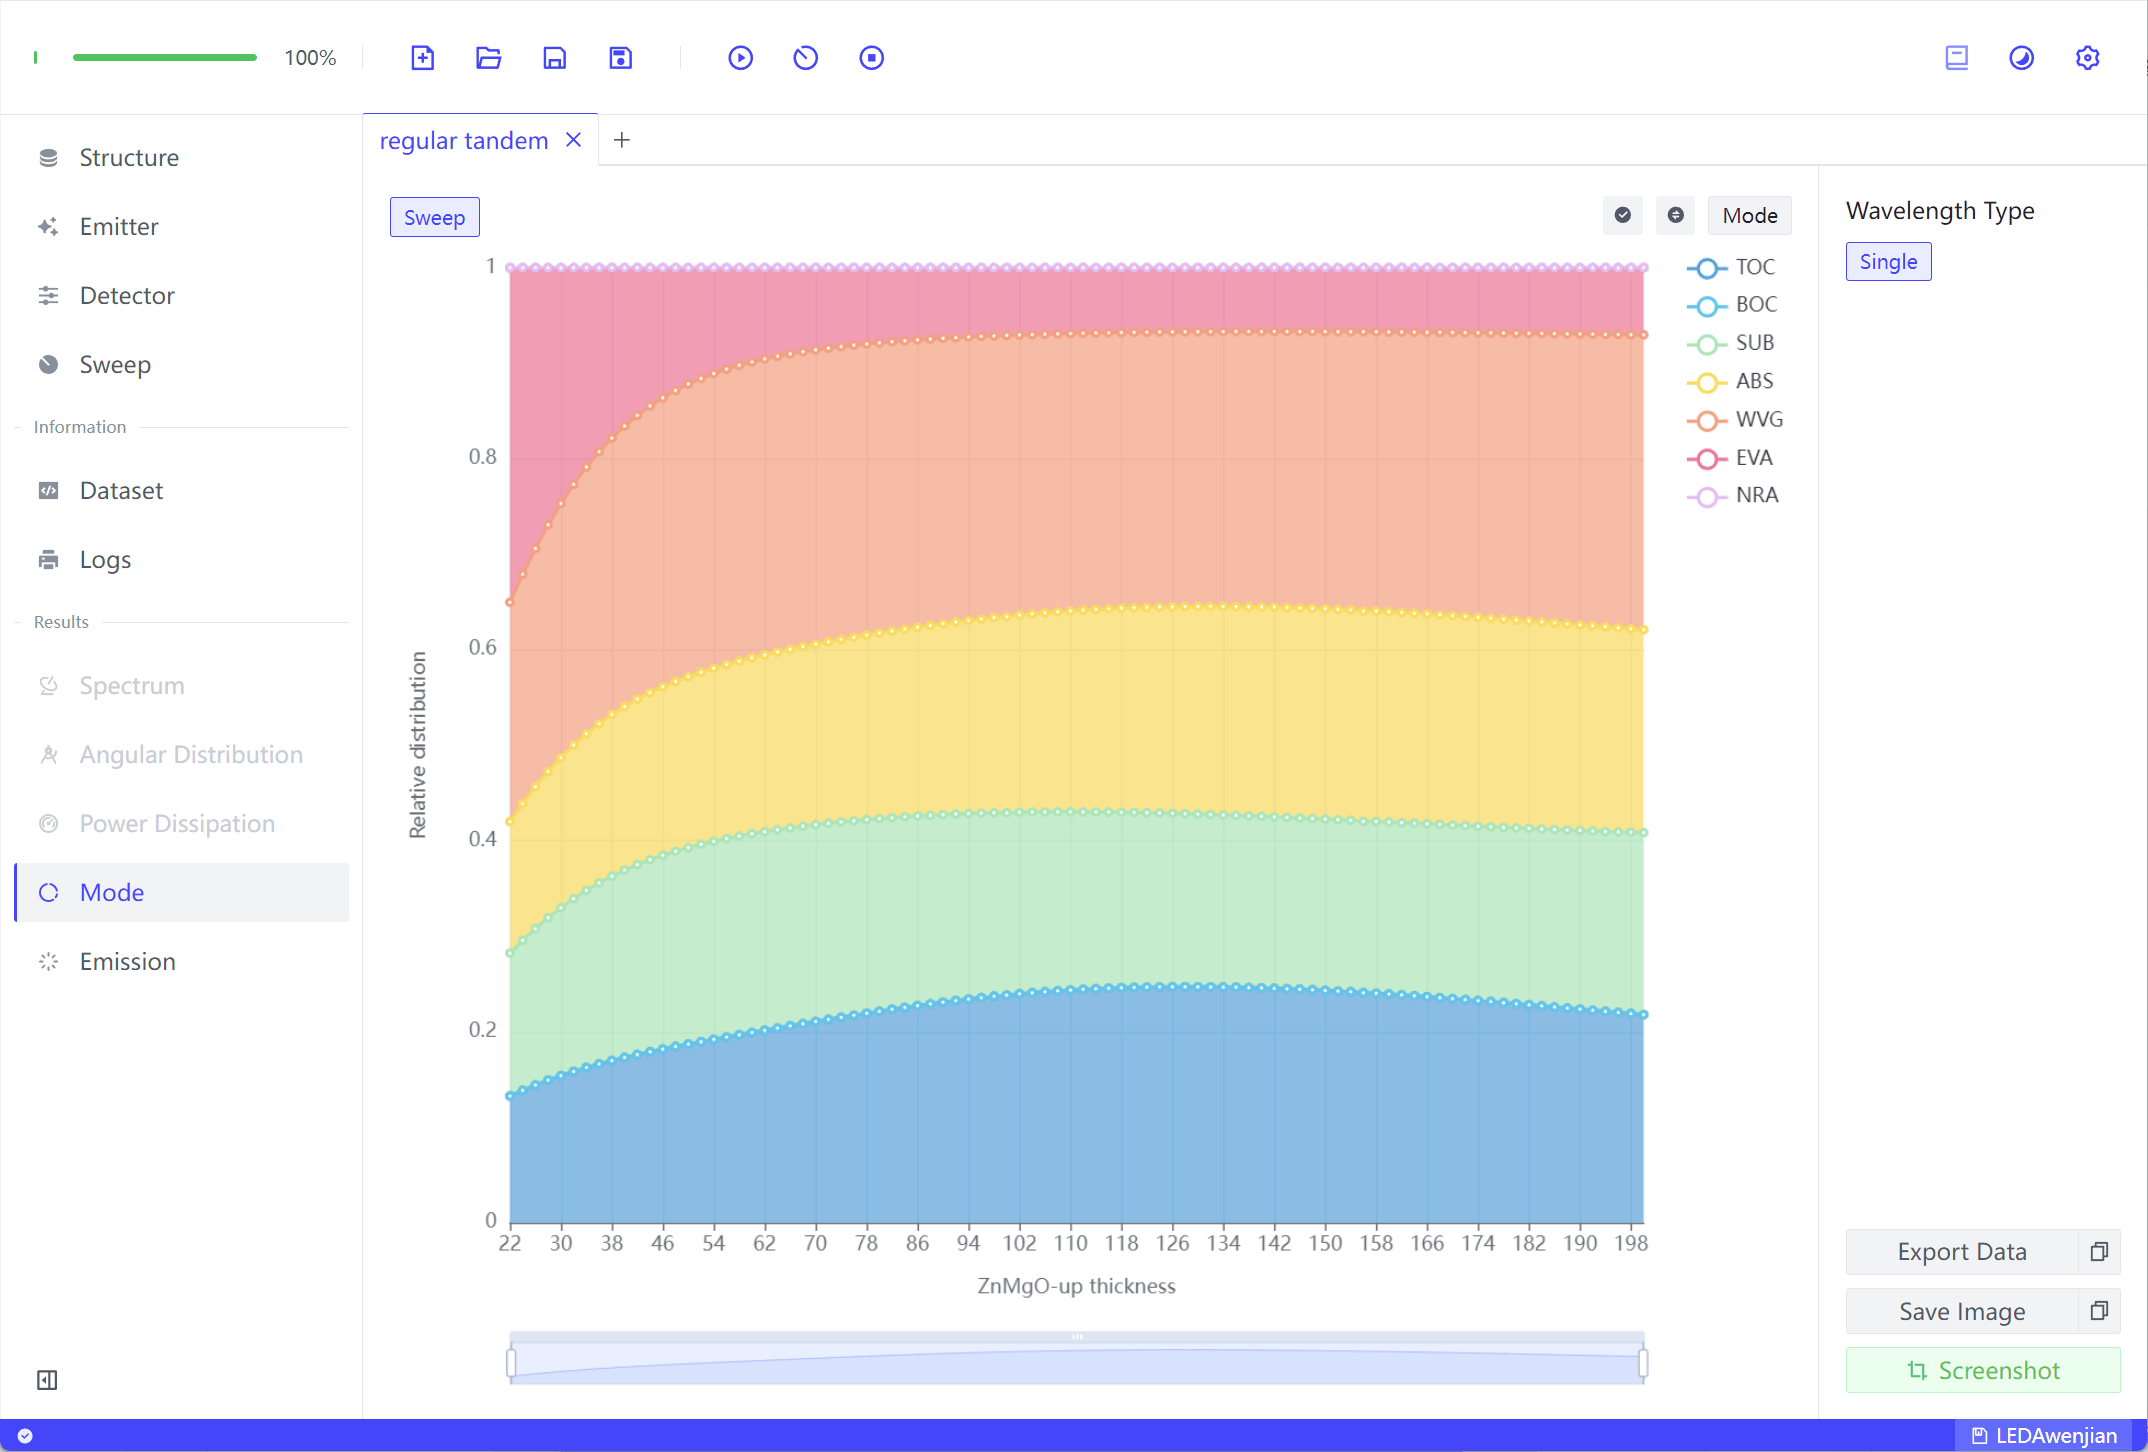
Click Run Sweep to obtain the scan results of the mode distribution of the regular tandem device as a function of the ZnMgO-up thickness. The mode distribution result is similar to the fraction of power in Figure 2(k).
Top Device
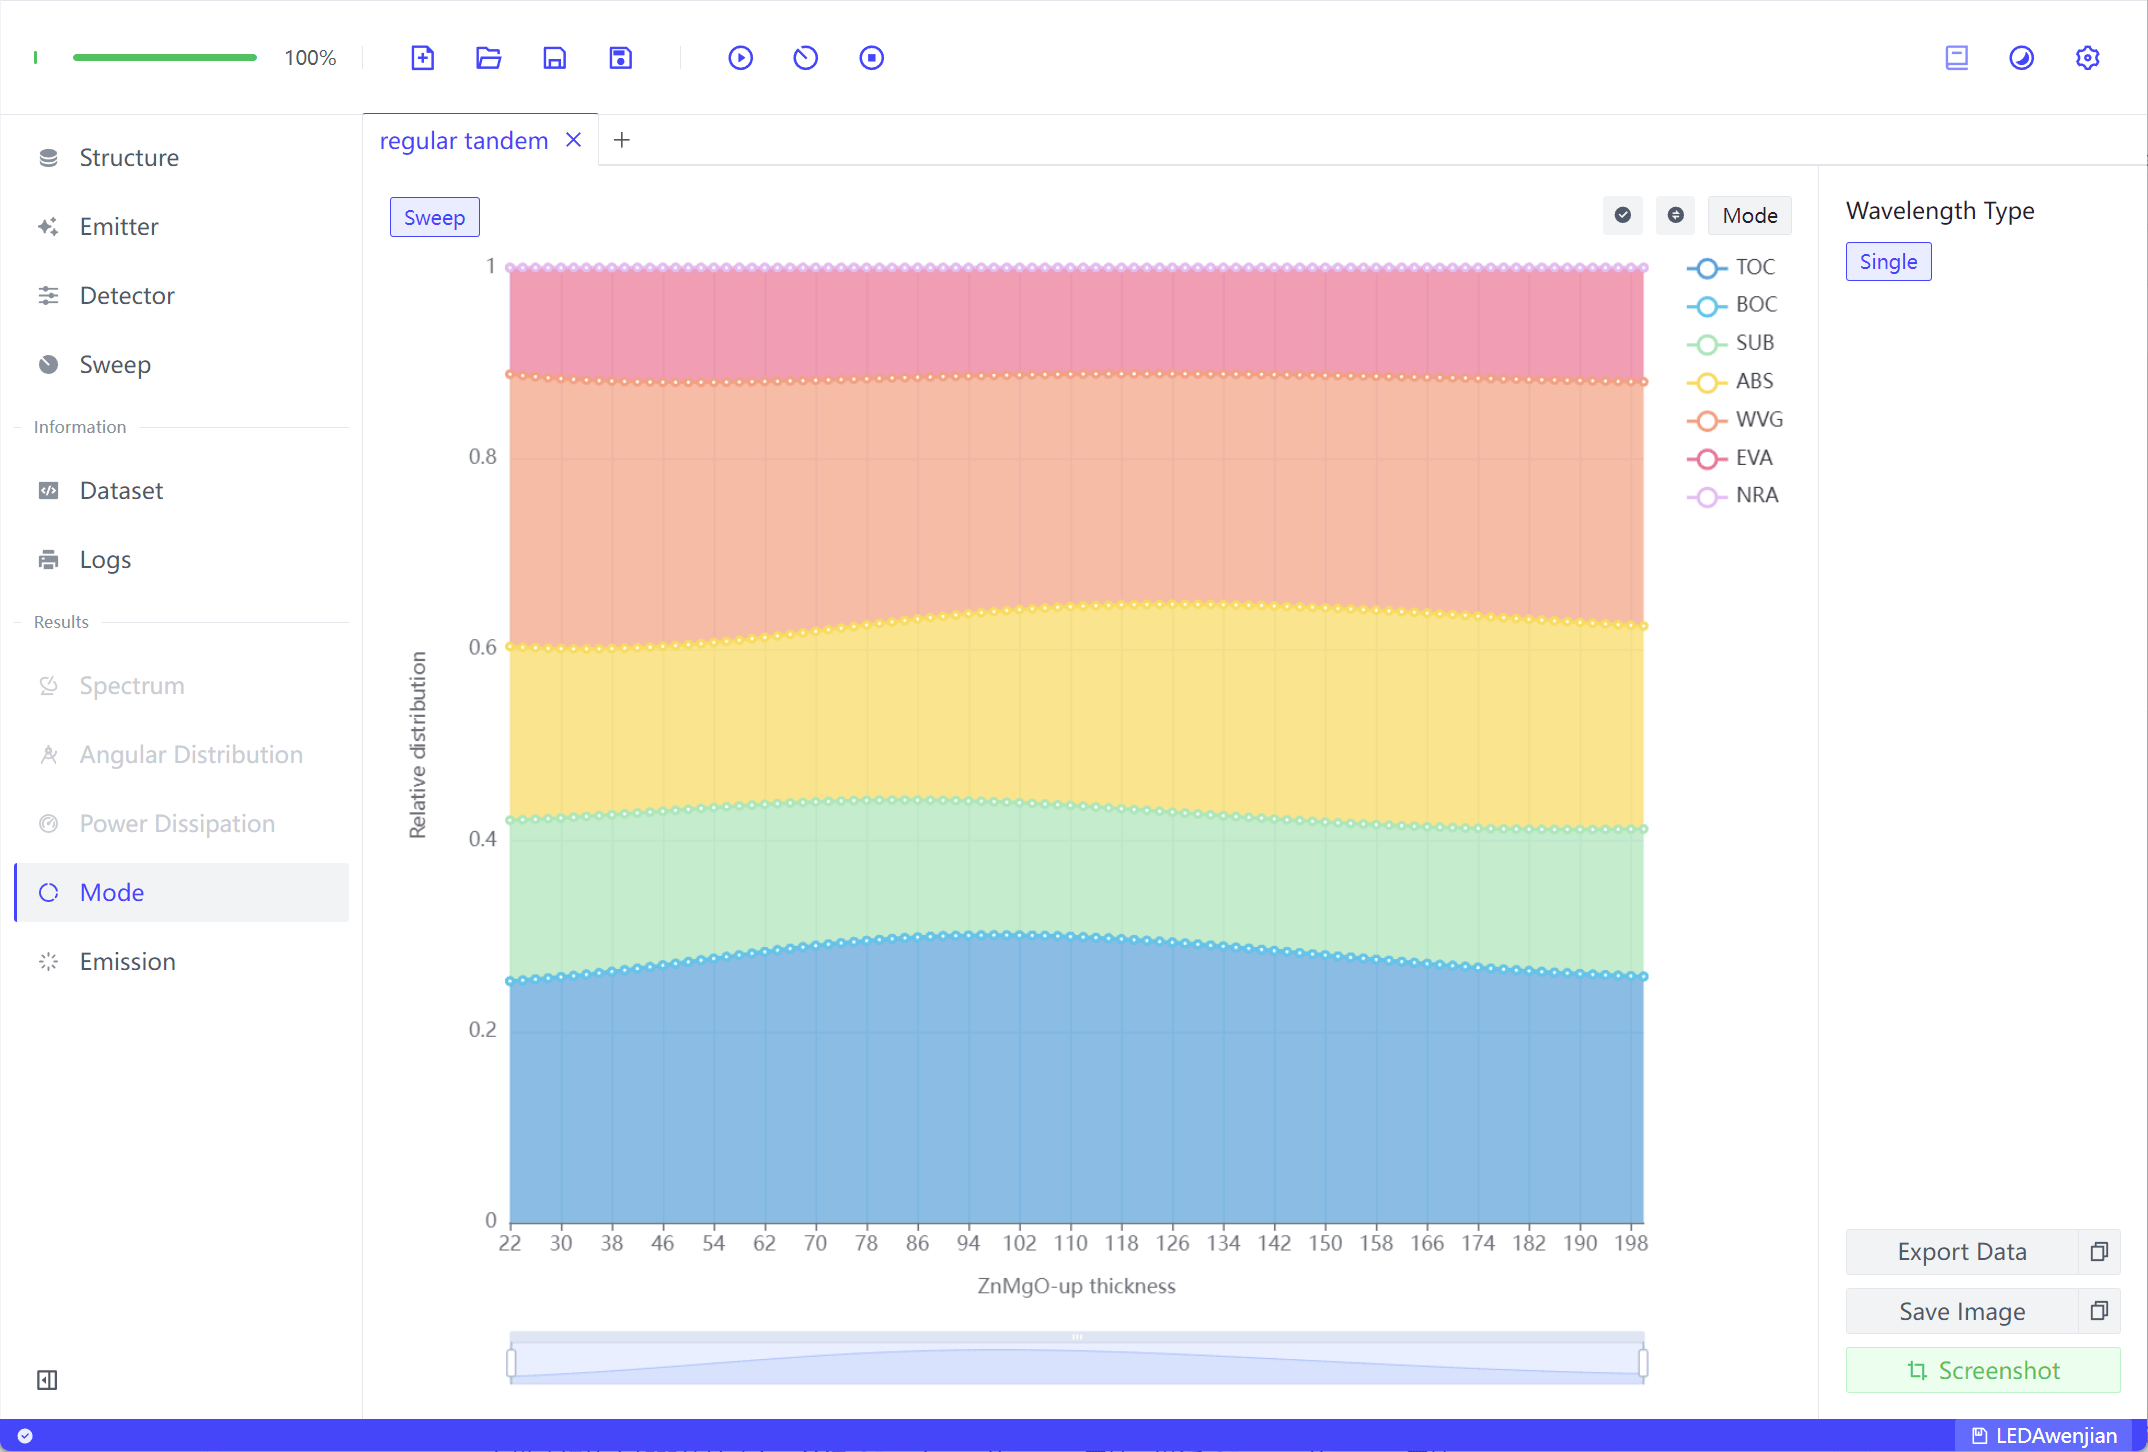
According to Figure 1(a), the top device consists of the ITO-CGL, 2PACz:6PA, TFB-down, QDs-down, ZnMgO-down, and Al cathode layers.
Based on the tandem device structure built above, disable the Emis. property of QDs-up and activate the Emis. property of QDs-down.
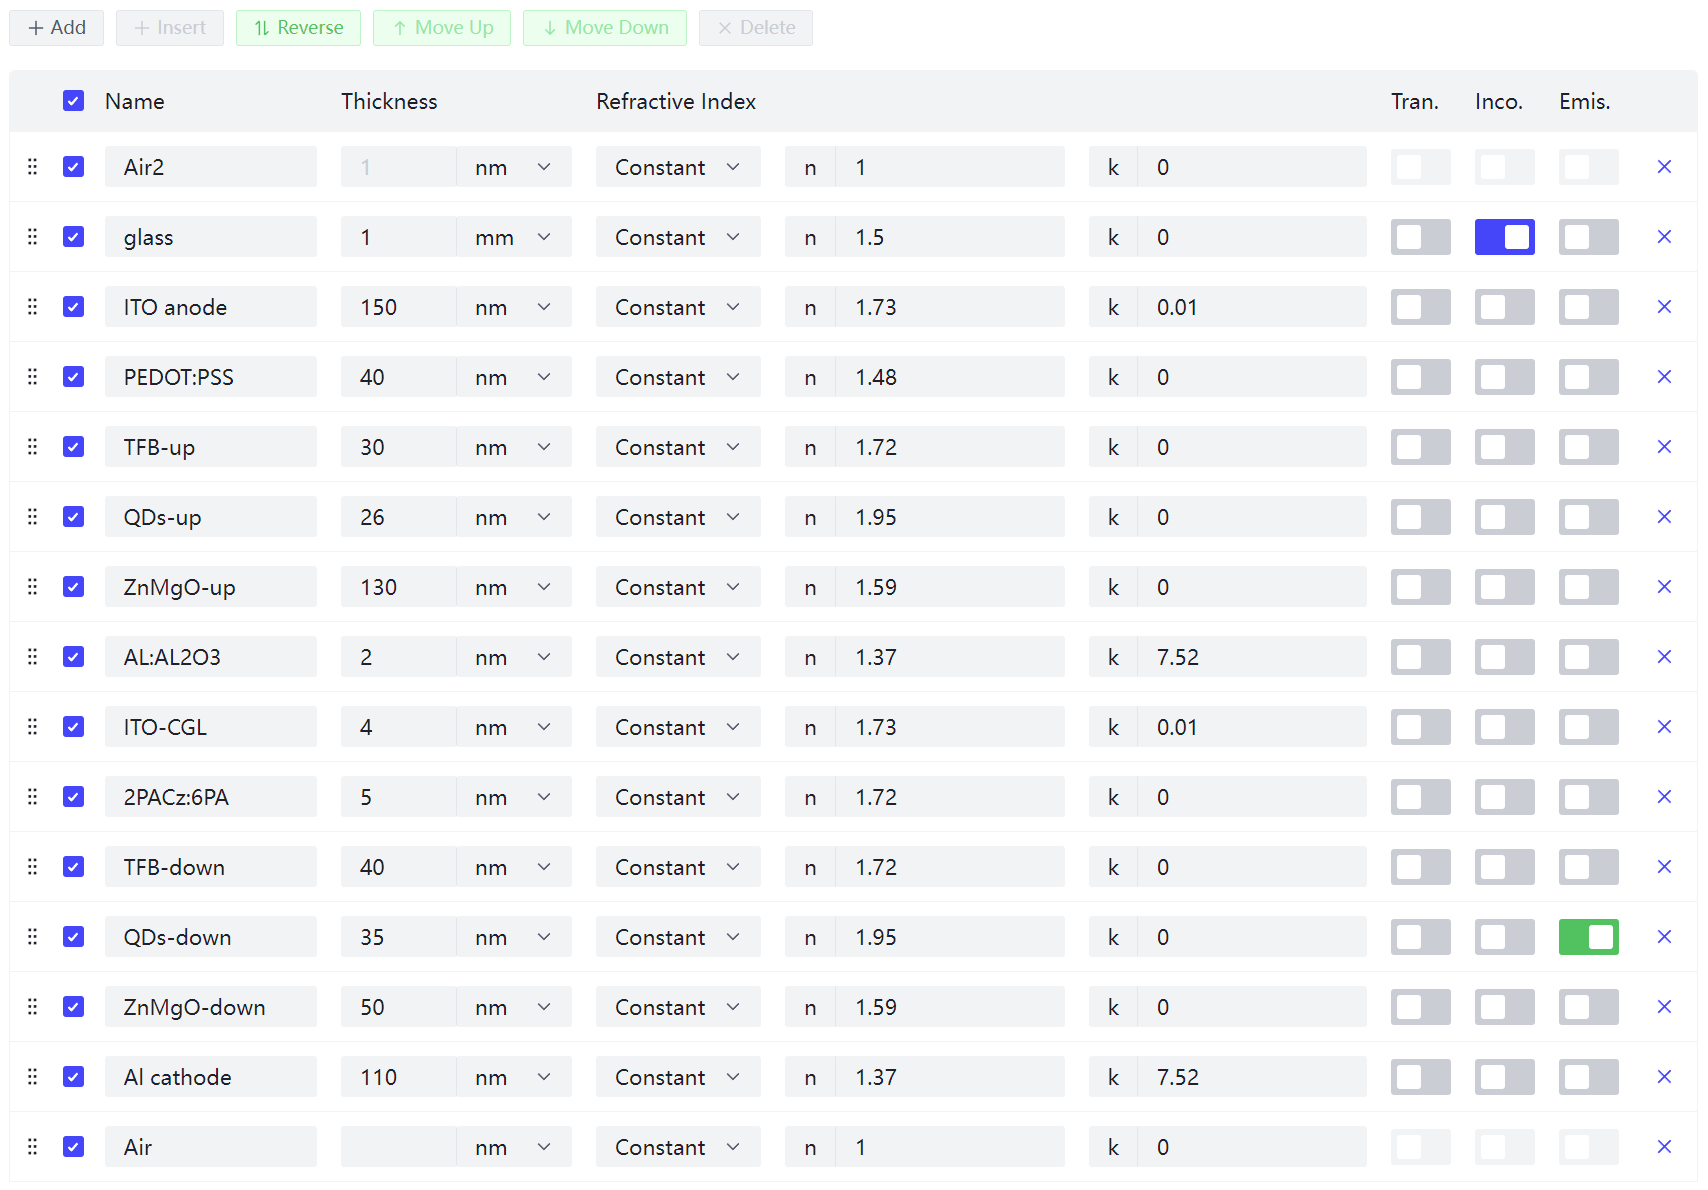
Click Run Sweep to obtain the scan results of the mode distribution for the top device as a function of the ZnMgO-up thickness. The mode distribution result is similar to the fraction of power in Figure 2(j).
Bottom Device
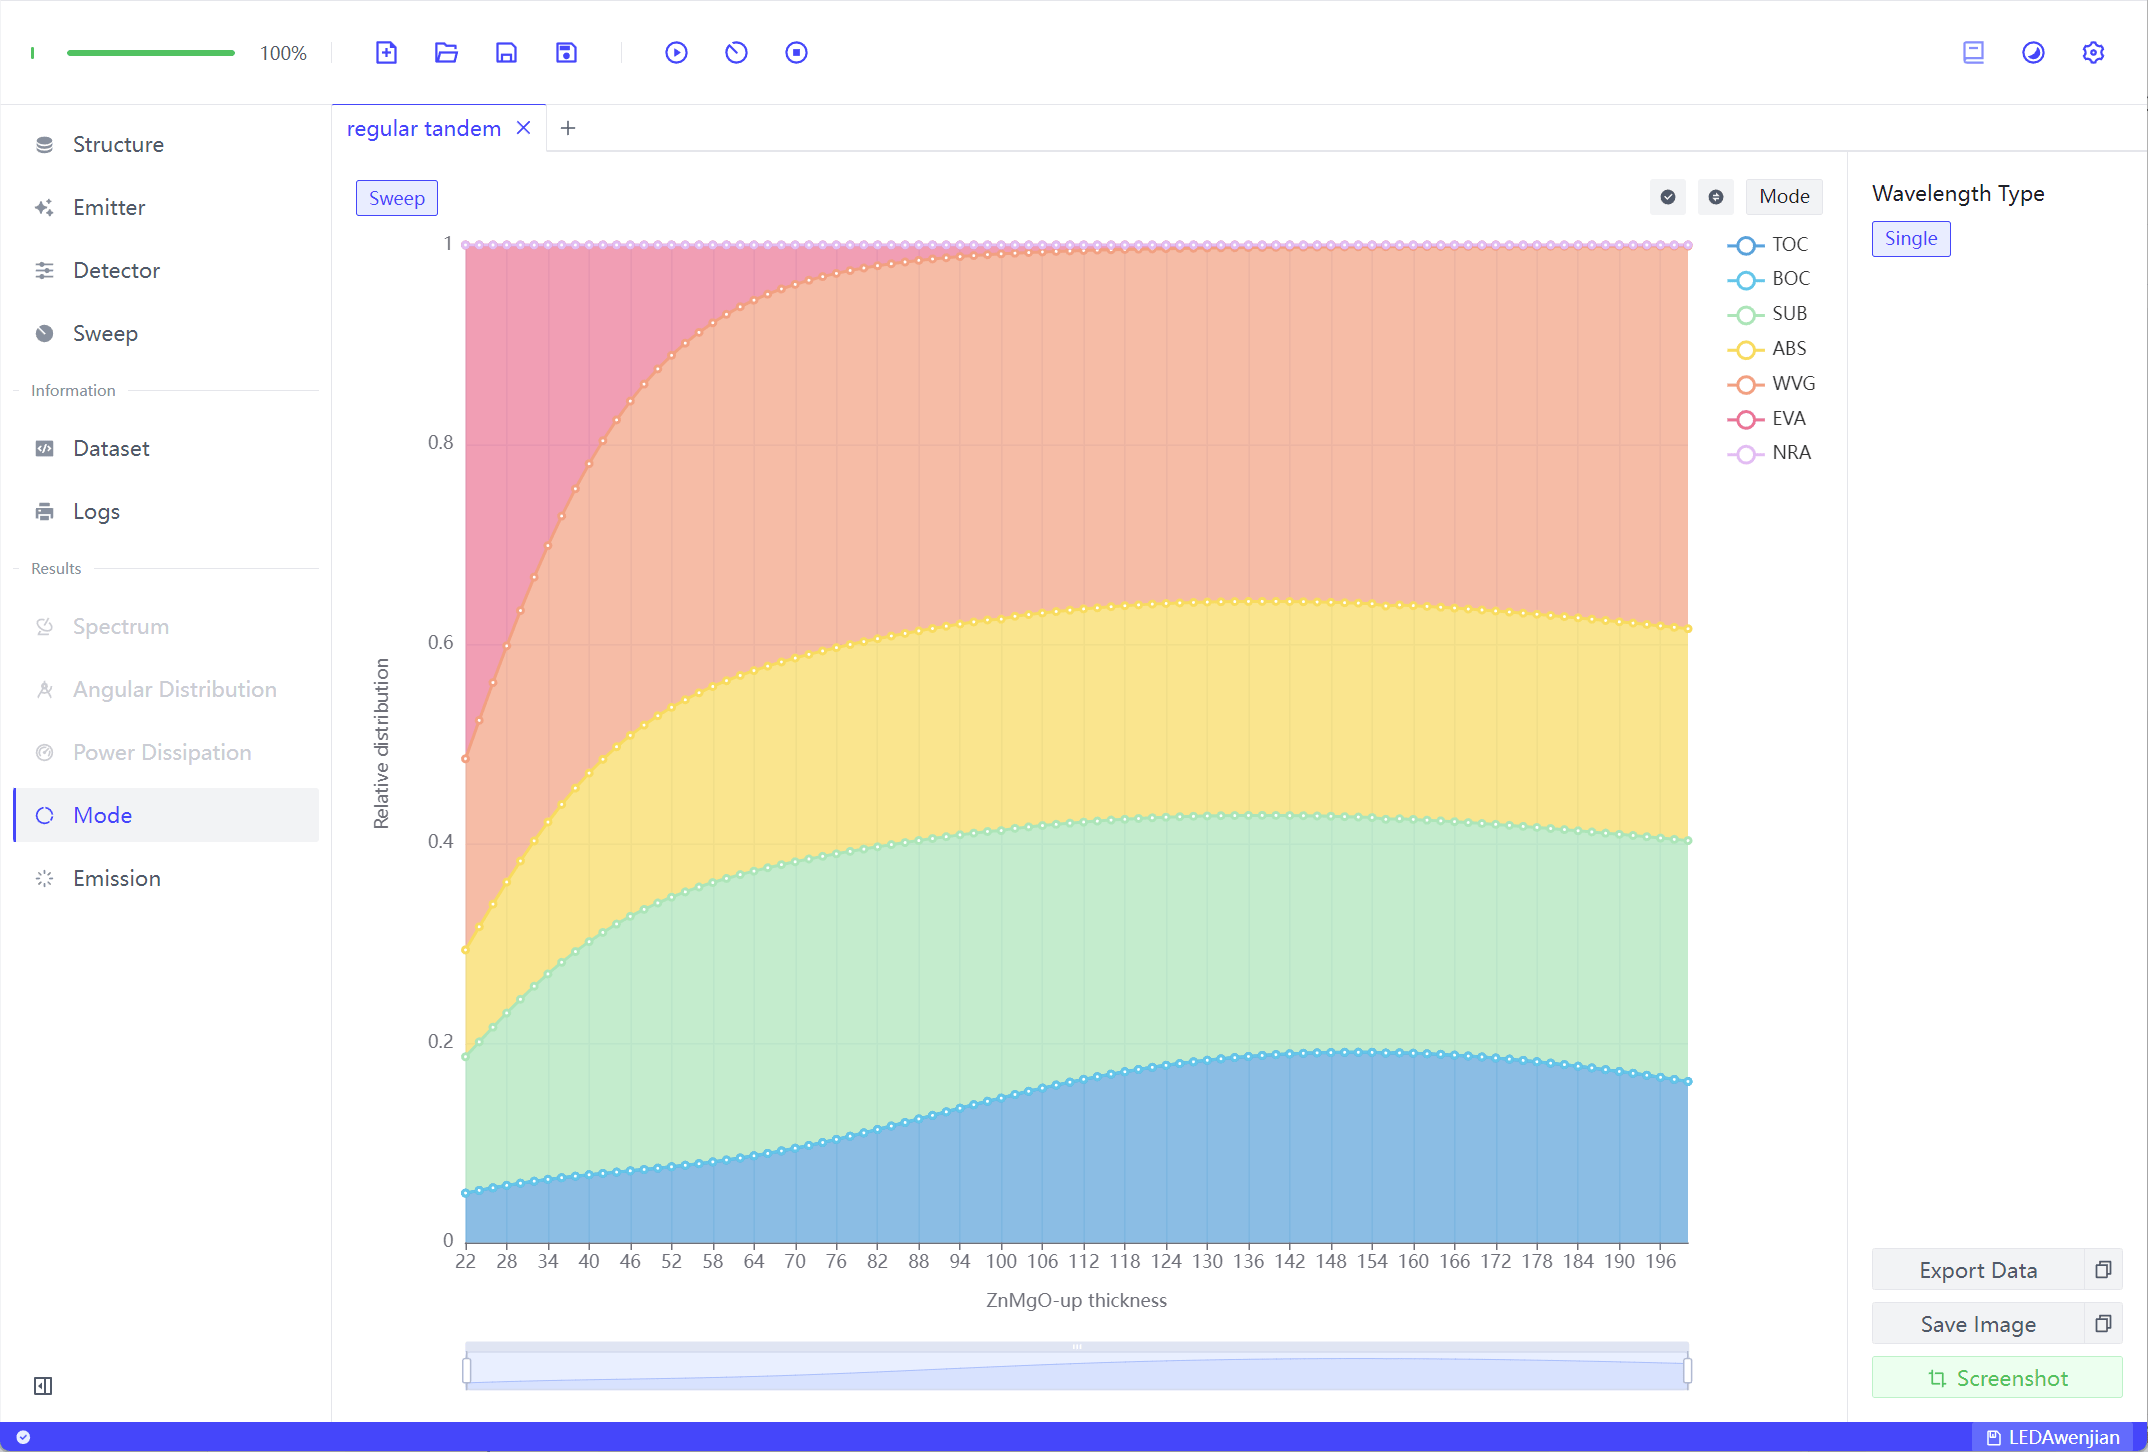
According to Figure 1(a), the bottom device consists of the ITO-anode, PEDOT:PSS, TFB-up, QDs-up, ZnMgO-up, and Al:Al2O3 layers.
Based on the constructed device, disable the Emis. property of QDs-down and activate the Emis. property of QDs-up.
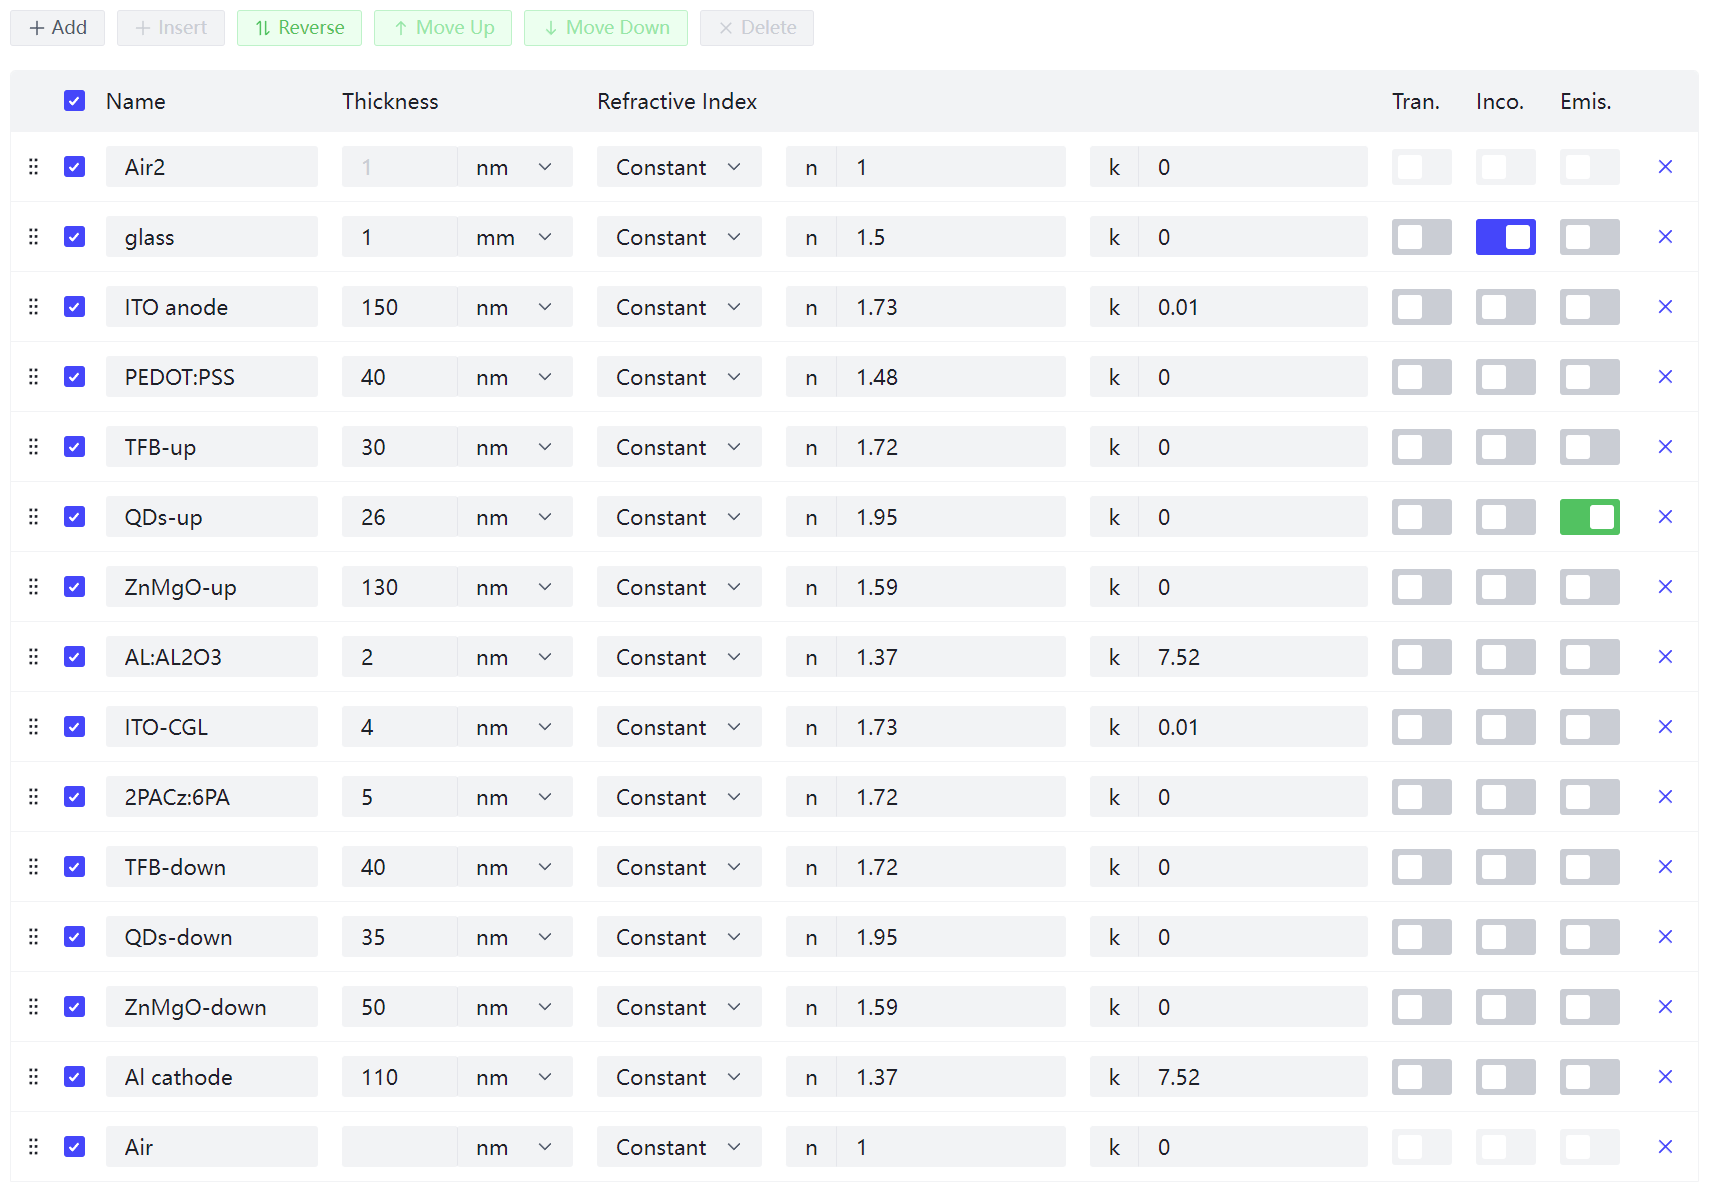
Click Run Sweep to obtain the sweep results of the mode distribution for the bottom device as a function of the ZnMgO-up thickness. The mode distribution result is similar to the fraction of power in Figure 2(i).
Summary
This case study demonstrates the optimization of a regular tandem QLED structure to achieve balanced charge injection and a high EQE. Optical simulations were used to investigate the contributions of the top and bottom devices to the overall OCE of the tandem structure.
The simulation results from Leda are generally consistent with the original paper. Some minor discrepancies in the specific values may exist due to potential differences in the data and algorithms used.