
Refractive Index Data
Angular-dependent Emission of Microcavity Top-emission PeLEDs
ContributorLezhi SUN
Microcavity top-emission perovskite light-emitting diodes Yanfeng Miao; Lu Cheng; Wei Zou; Lianghui Gu; Ju Zhang; Qiang Guo; Qiming Peng; Mengmeng Xu; Yarong He; Shuting Zhang; Yu Cao; Renzhi Li; Nana Wang; Wei Huang; Jianpu Wang
Highlights
This article demonstrates a significant improvement in the light extraction efficiency of Perovskite LEDs (PeLEDs) by constructing a Fabry-Perot microcavity structure, achieving a high external quantum efficiency (EQE) of 20.2% and an ultra-high radiant exitance of 114.9 mW cm⁻². The study systematically optimizes the electrical and optical properties of the device by tuning the cavity length, top electrode thickness, and the position of the emissive layer within the cavity. The presence of the microcavity effect is confirmed through angle-dependent emission spectrum analysis, which also reveals its role in enhancing small-angle emission, showcasing the great potential of microcavity structures in improving PeLED performance.
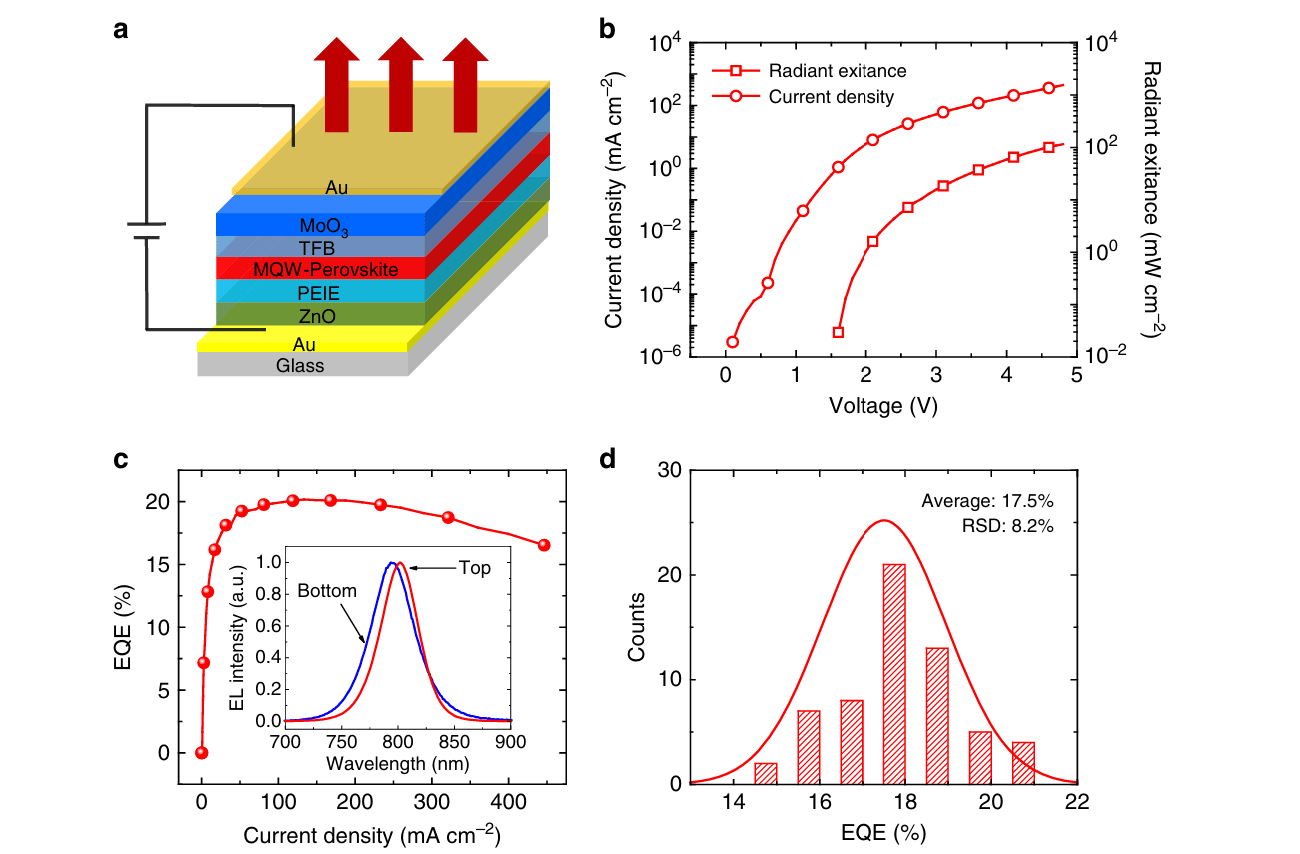
Fig. 1. a Structure of the top-emission PeLEDs (TE-PeLEDs). A thick gold film was used as the total-reflection bottom electrode, and a thin gold film was used as the semitransparent top electrode, forming a Fabry–Perot microcavity. The light is emitted through the top electrode.
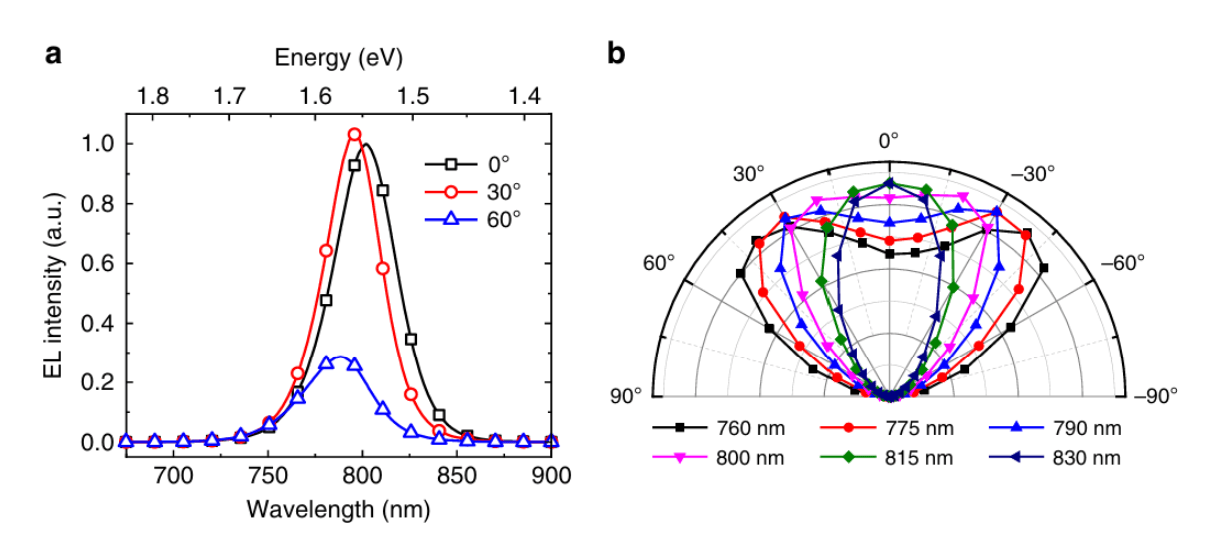
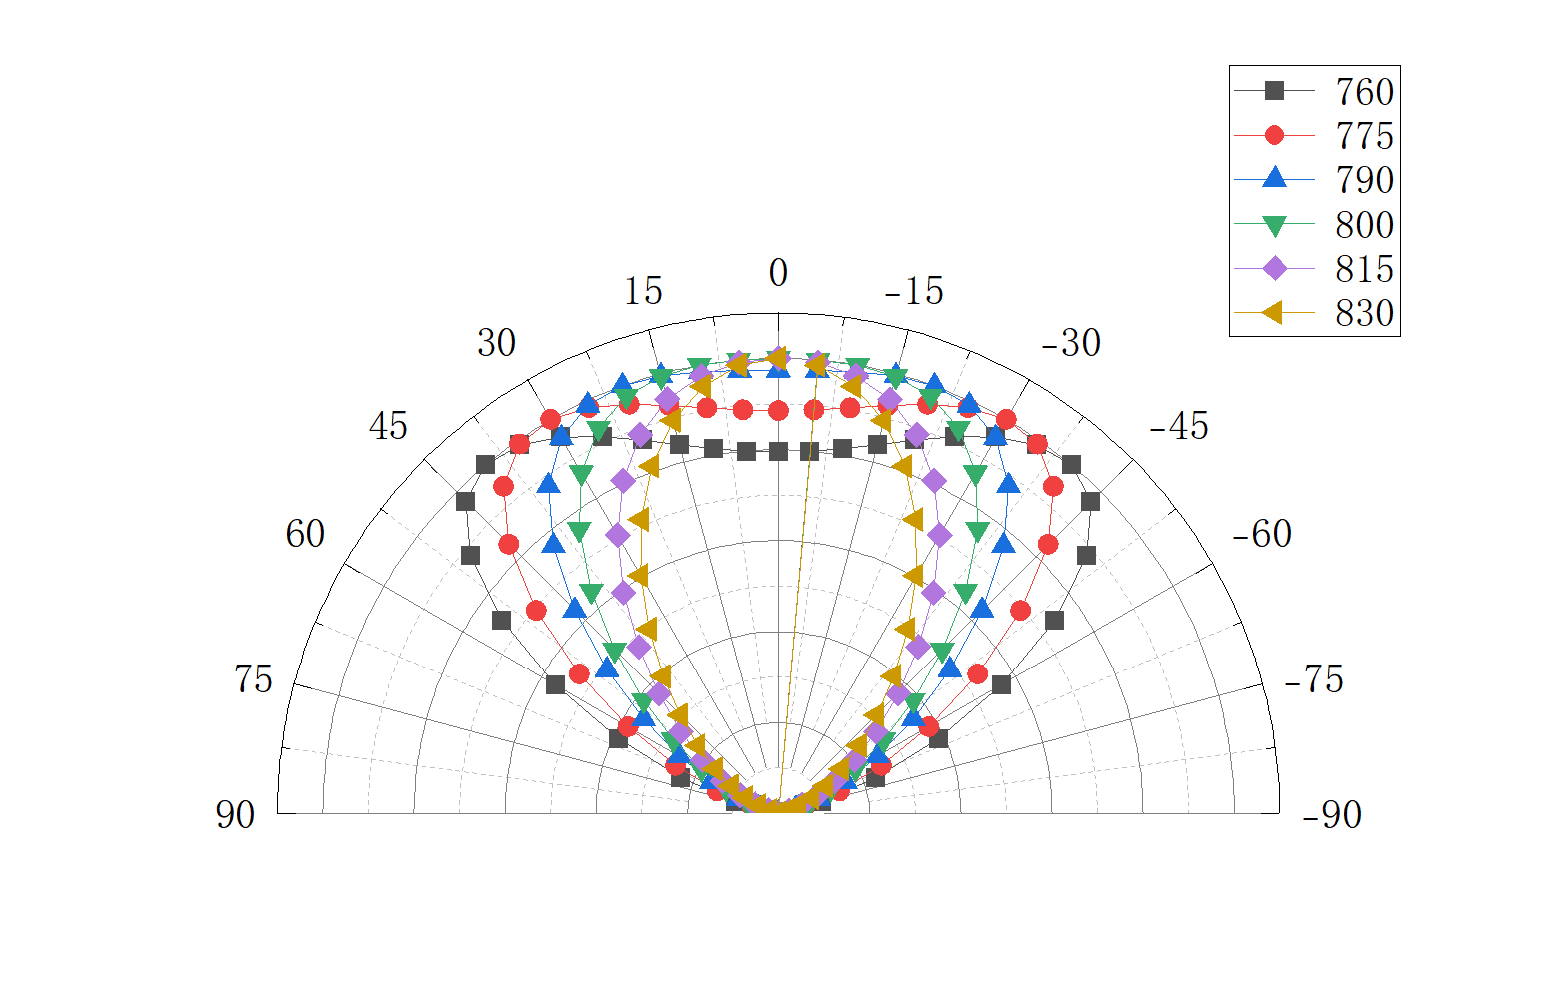
Fig. 2 Angle-dependent emission characteristics of the PeLED. a Electroluminescence (EL) spectra of the TE-PeLED at 0°, 30°, and 60°. The EL spectra show a blue shift as the viewing angle increases. b Angle-dependent emission characteristics of the TE-PeLED at different wavelengths, clearly showing that most of the EL is small-angle light.
Prerequisites
Install and activate Leda according to the Installation and Licensing.
The authors provided the spectral data in Figure S7.a and the material refractive index data in Figure S9.a-f of the Supplementary Information.
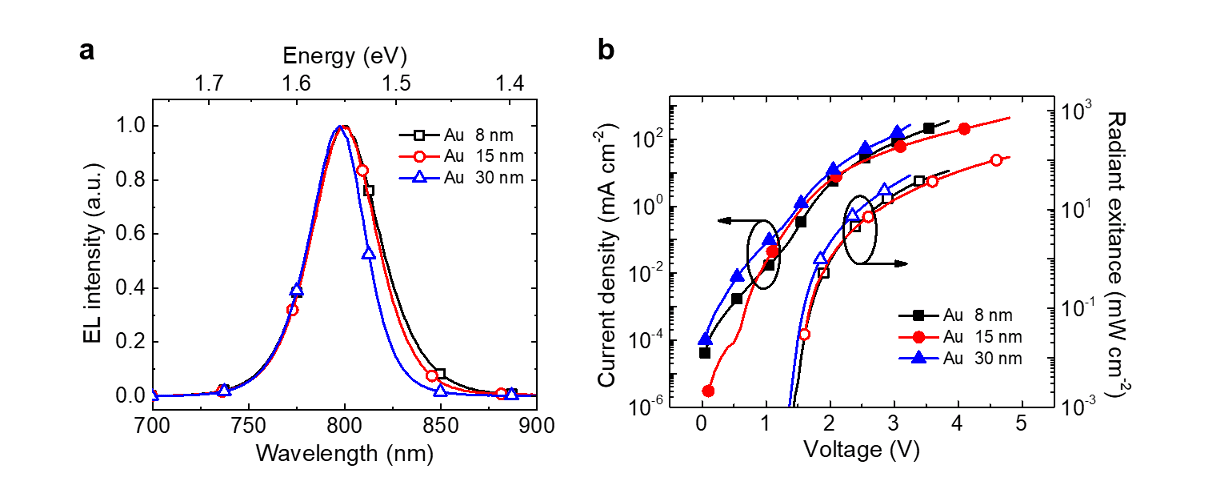
Fig. S7. a, Electroluminescence (EL) spectra of TE-PeLEDs with different top electrode thicknesses.
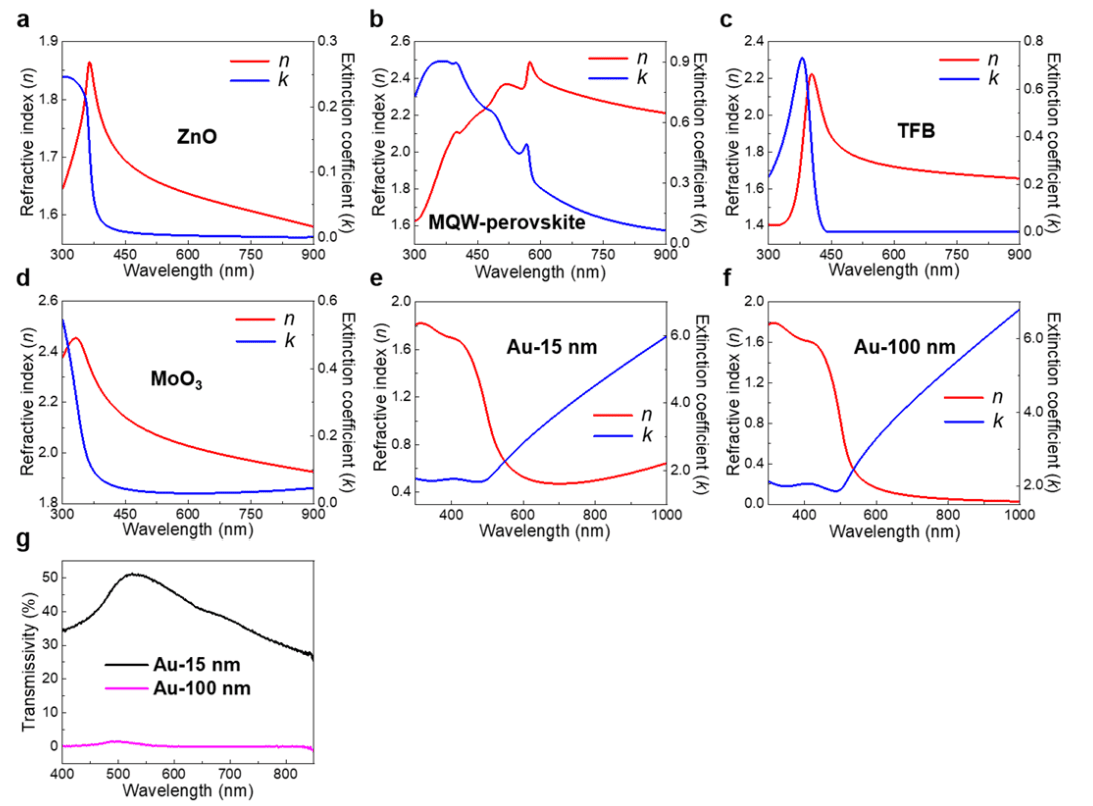
Fig. S9. a-f Refractive index (n) and extinction coefficient (k) of ZnO, MQW perovskite, TFB, and MoO3 layers, as well as Au-15 nm and Au-100 nm.
Download the following data to your local machine.
Spectrum Data
The data is for this case study only. If you use the data in a real project, please cite: Miao et al., 2020
Simulation Verification
We will use Leda to reproduce the simulation results in Fig. 2.
Angle-Dependent Characteristics of PeLED Spectra
First, build the TE-PeLED structure according to Fig. 1.a, and import the refractive index data provided by the authors for each layer. Activate the Emis. property of MQW-Pe and set it as the EML. Since the authors noted that PEIE was used to modify the ZnO layer, uncheck the PEIE layer here. Also, be sure to uncheck the Glass layer, as the 100 nm Au layer prevents most light from reaching it (see the discussion in Layer Properties for details).
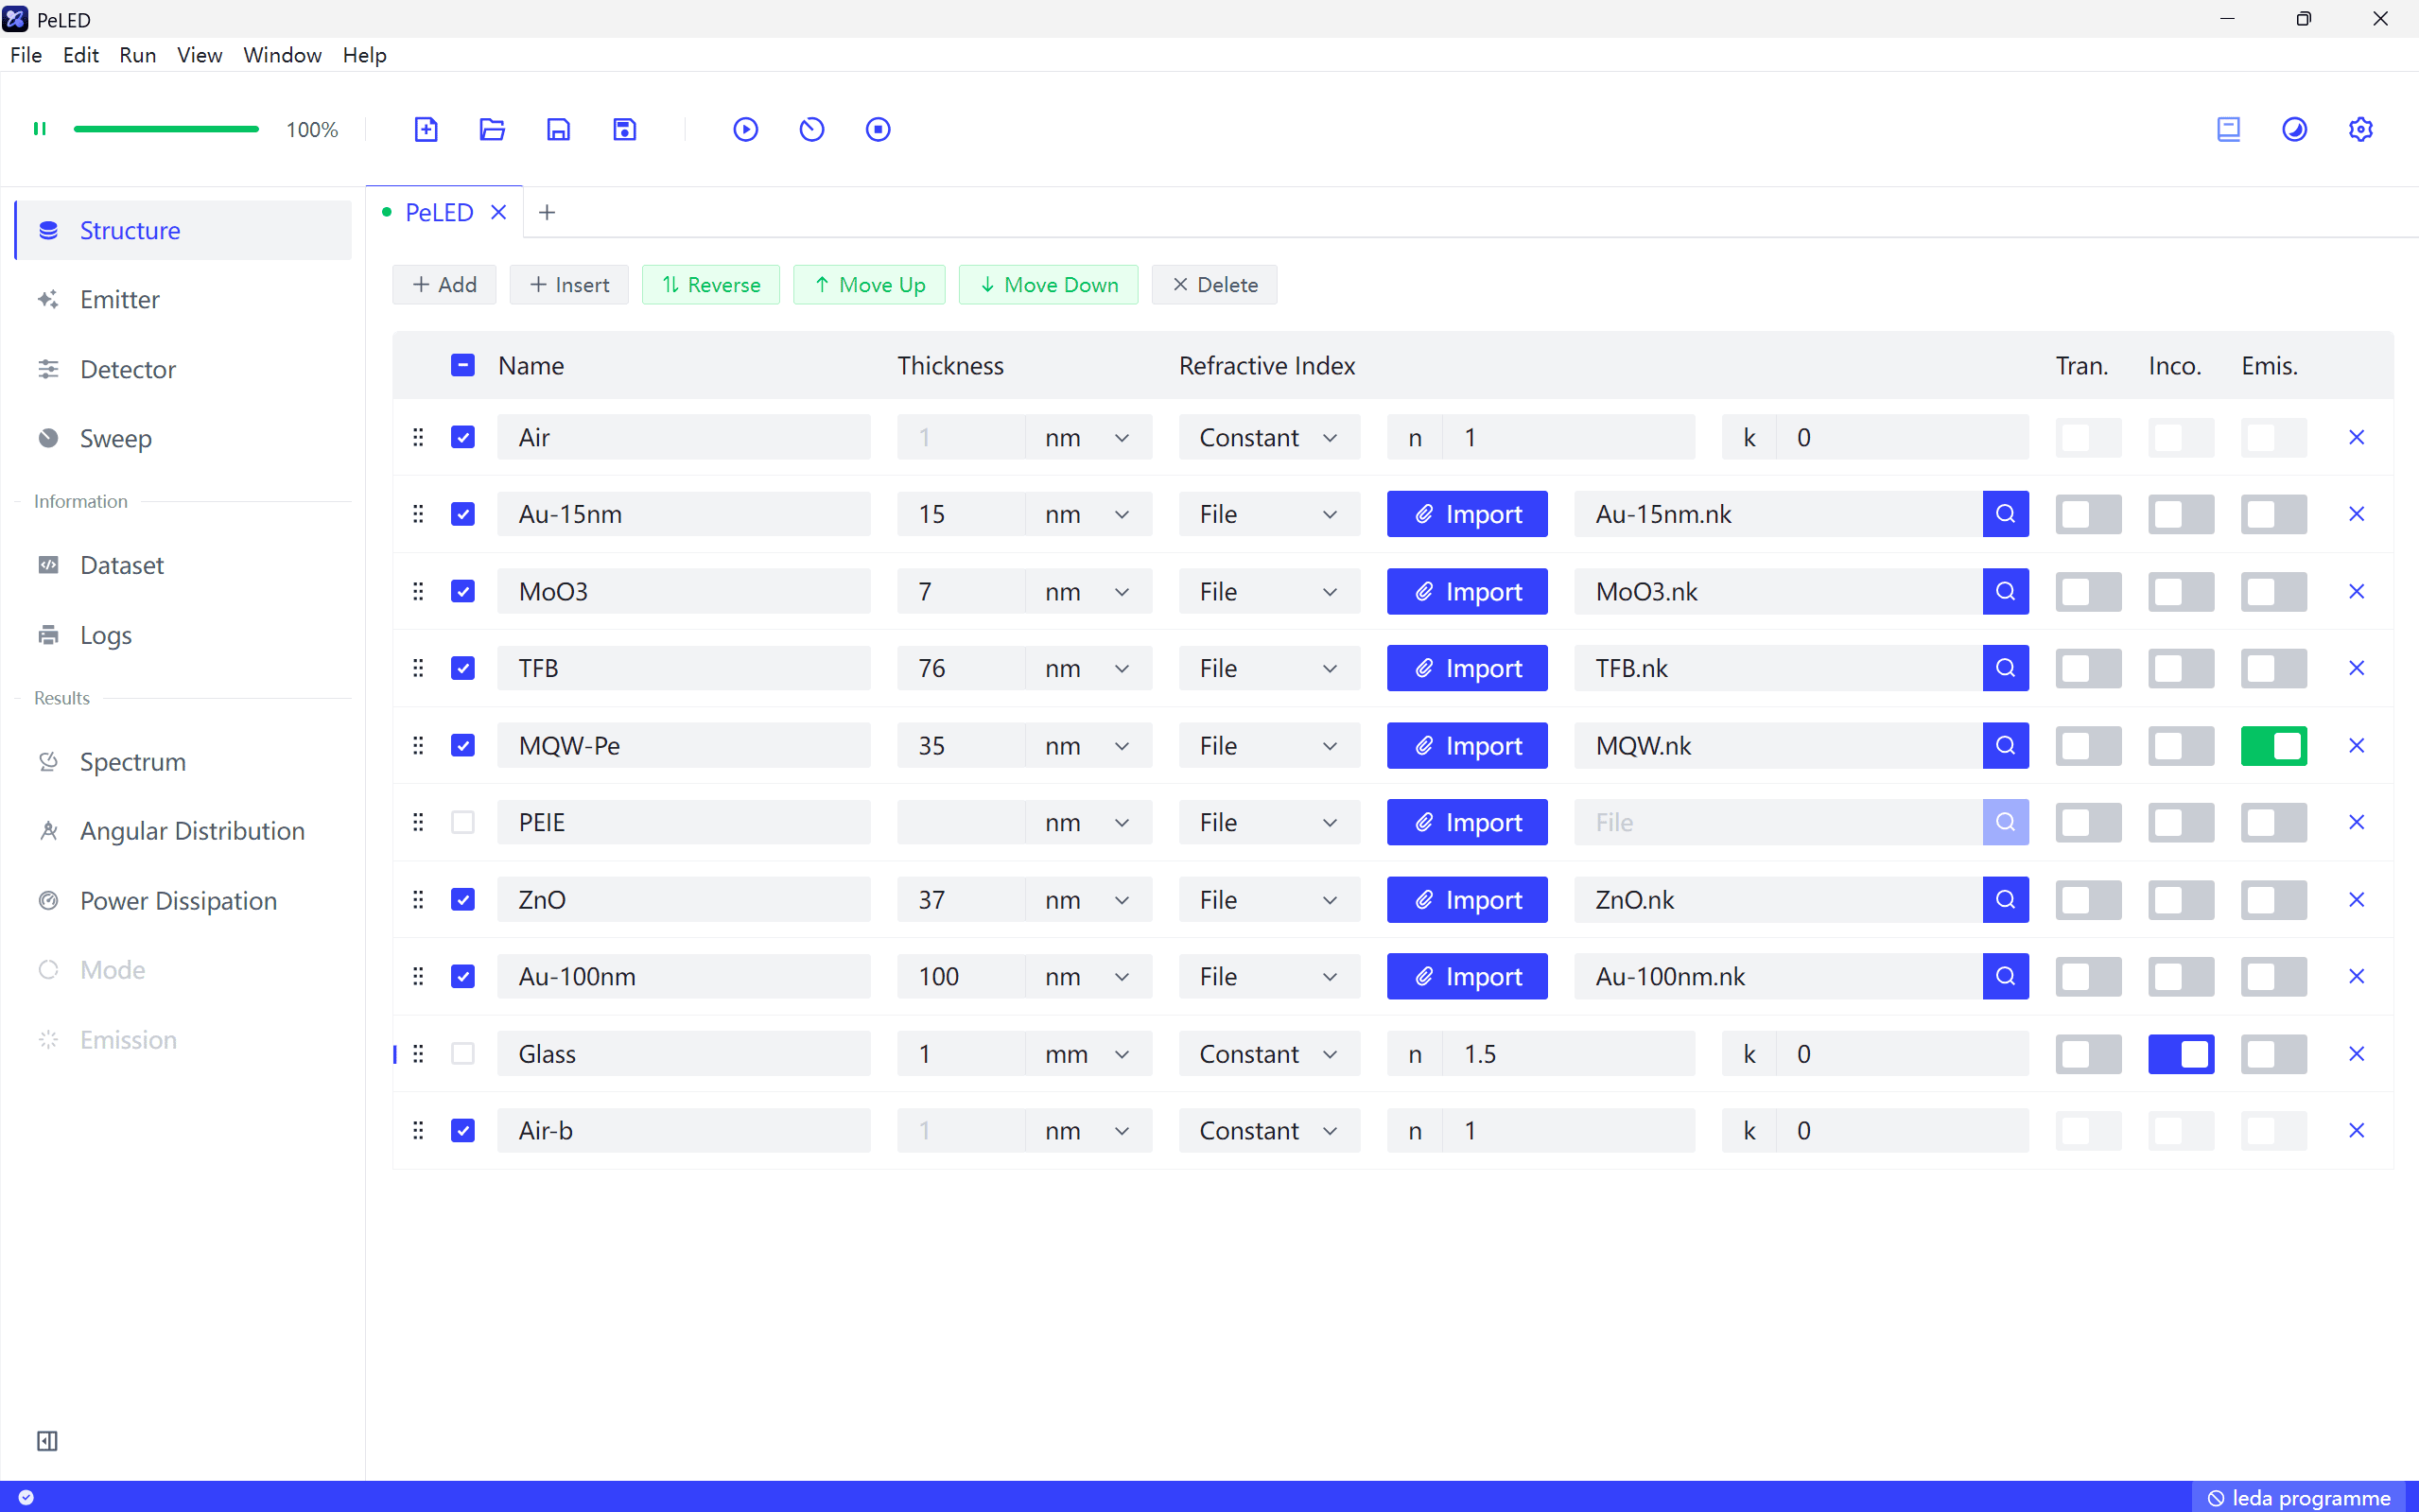
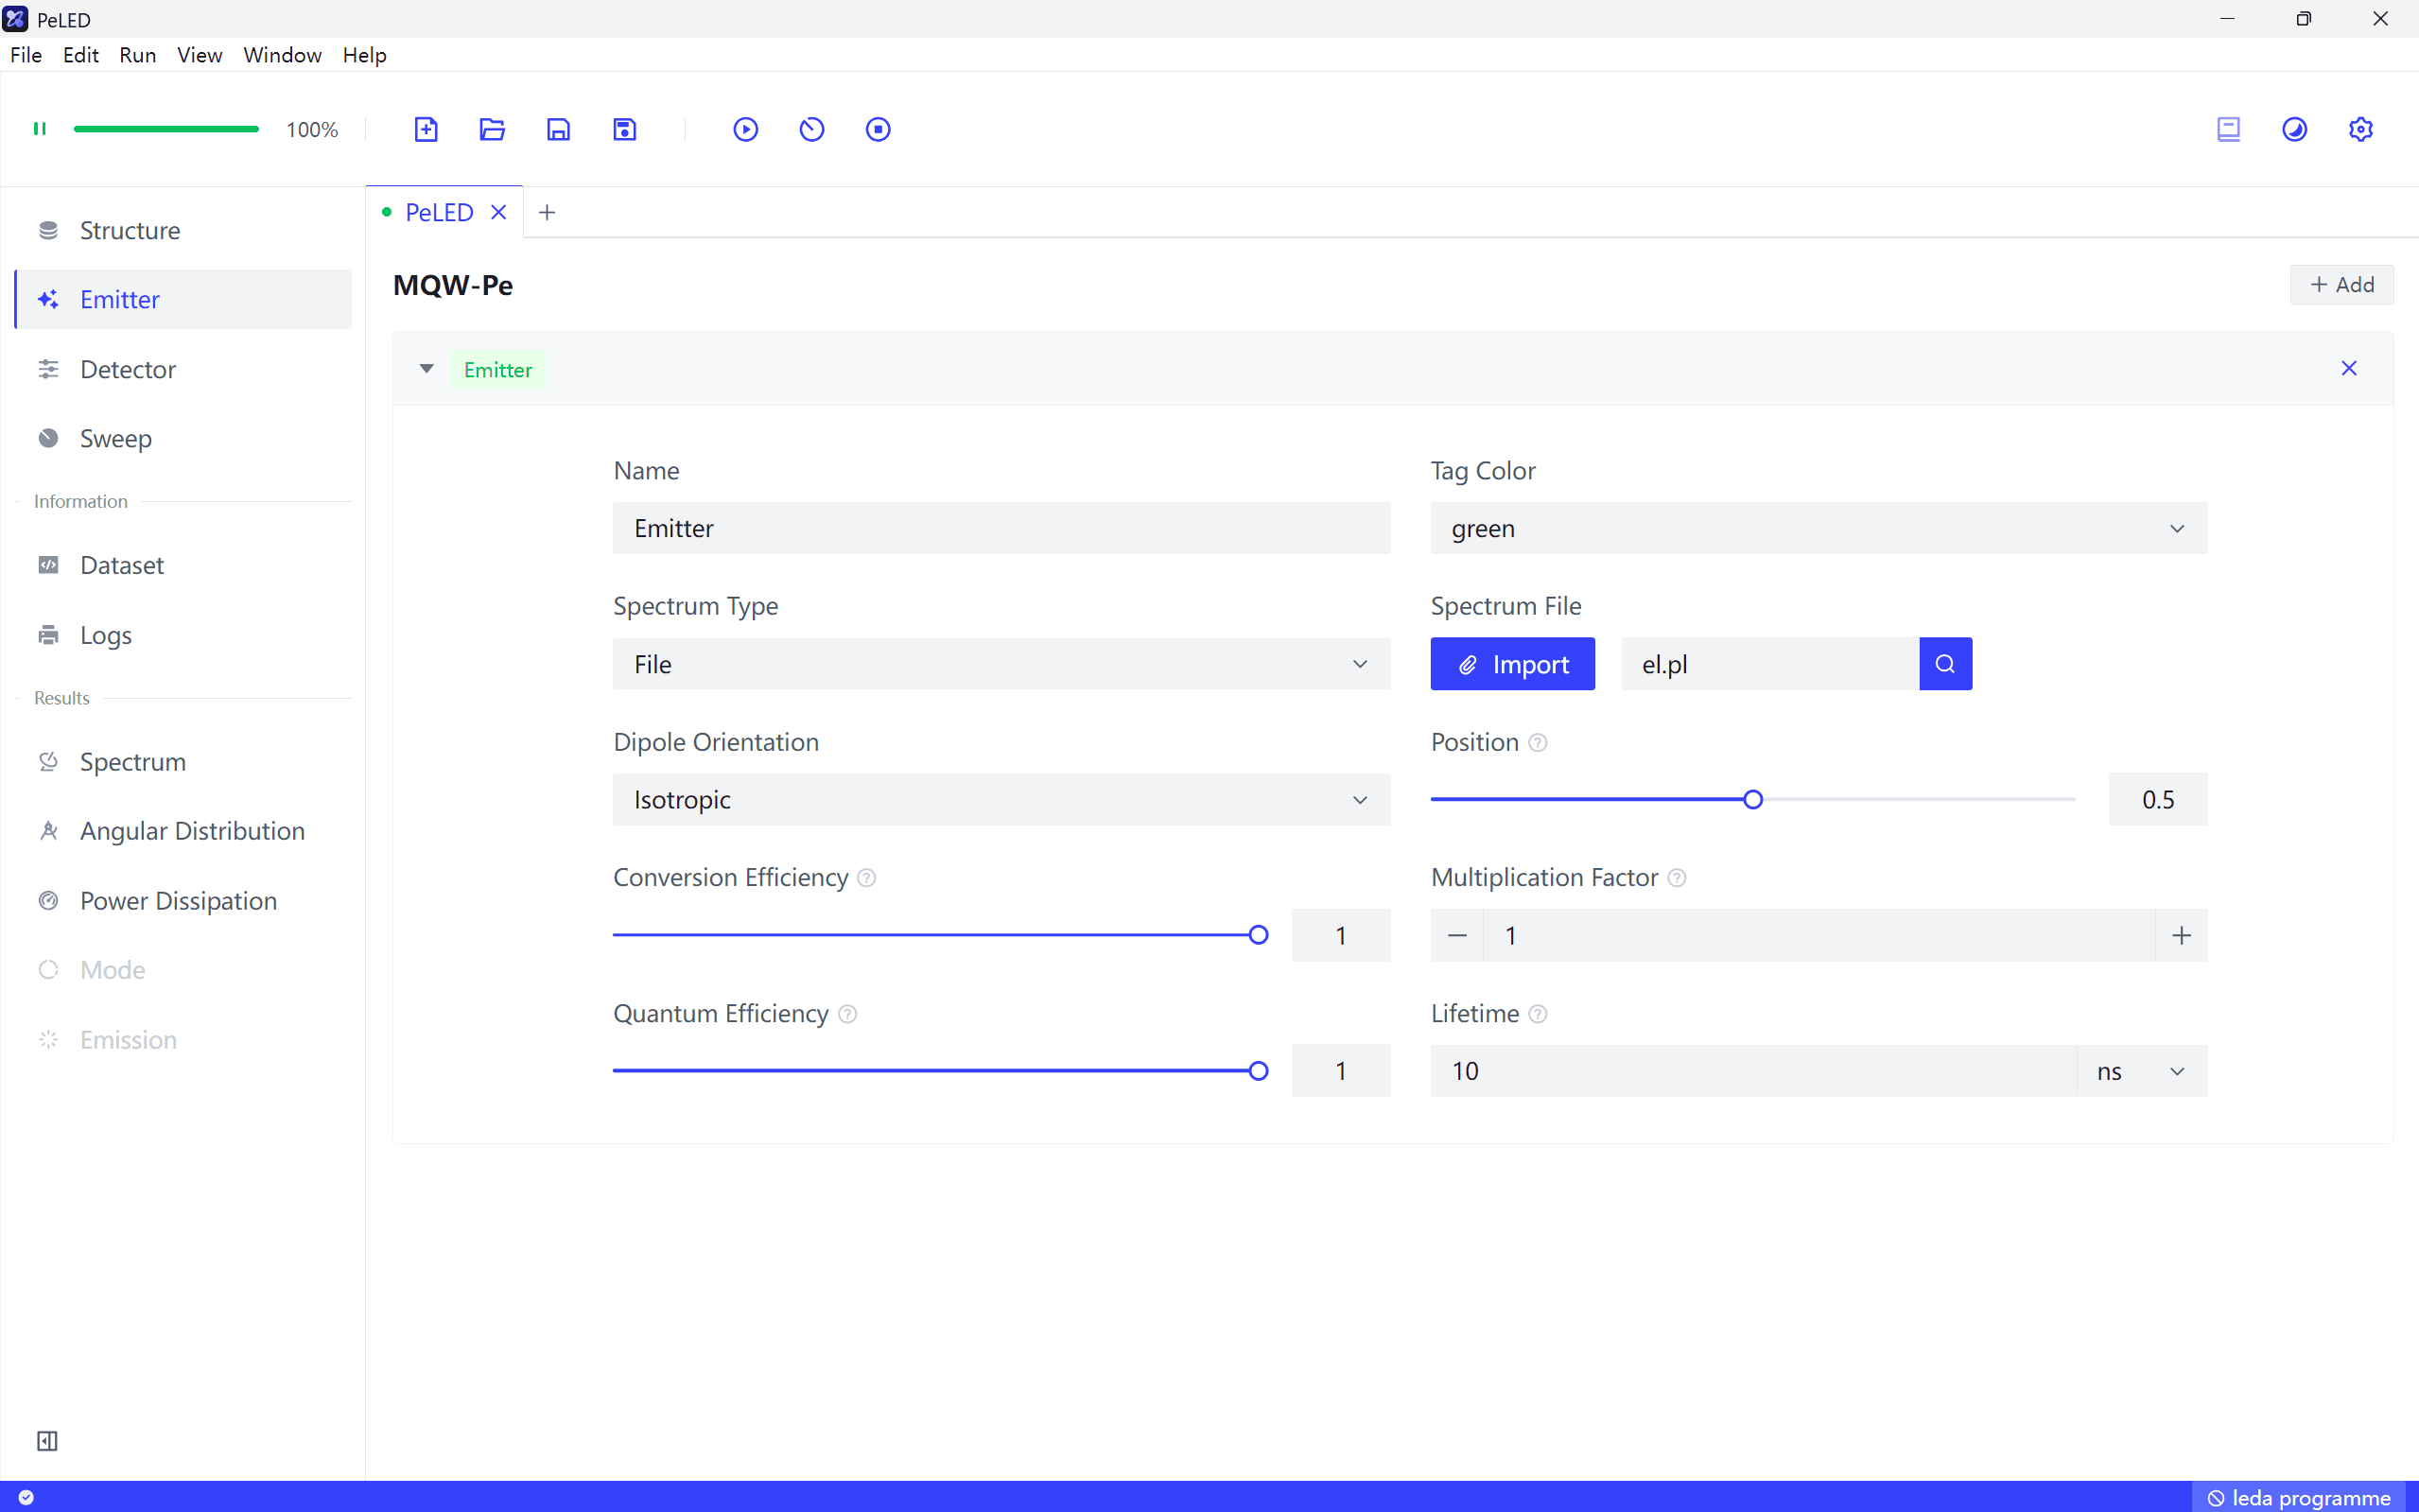
Import the EL spectrum provided by the authors into the Emitter. According to the discussion in Spectrum, we should use the PL spectrum. Since the original paper only provides the EL spectrum, we will extract the EL spectrum for an Au thickness of 15 nm from Figure S7.a for the simulation. It is important to note that using the EL spectrum, which is affected by the device’s microcavity effect, will introduce some error.
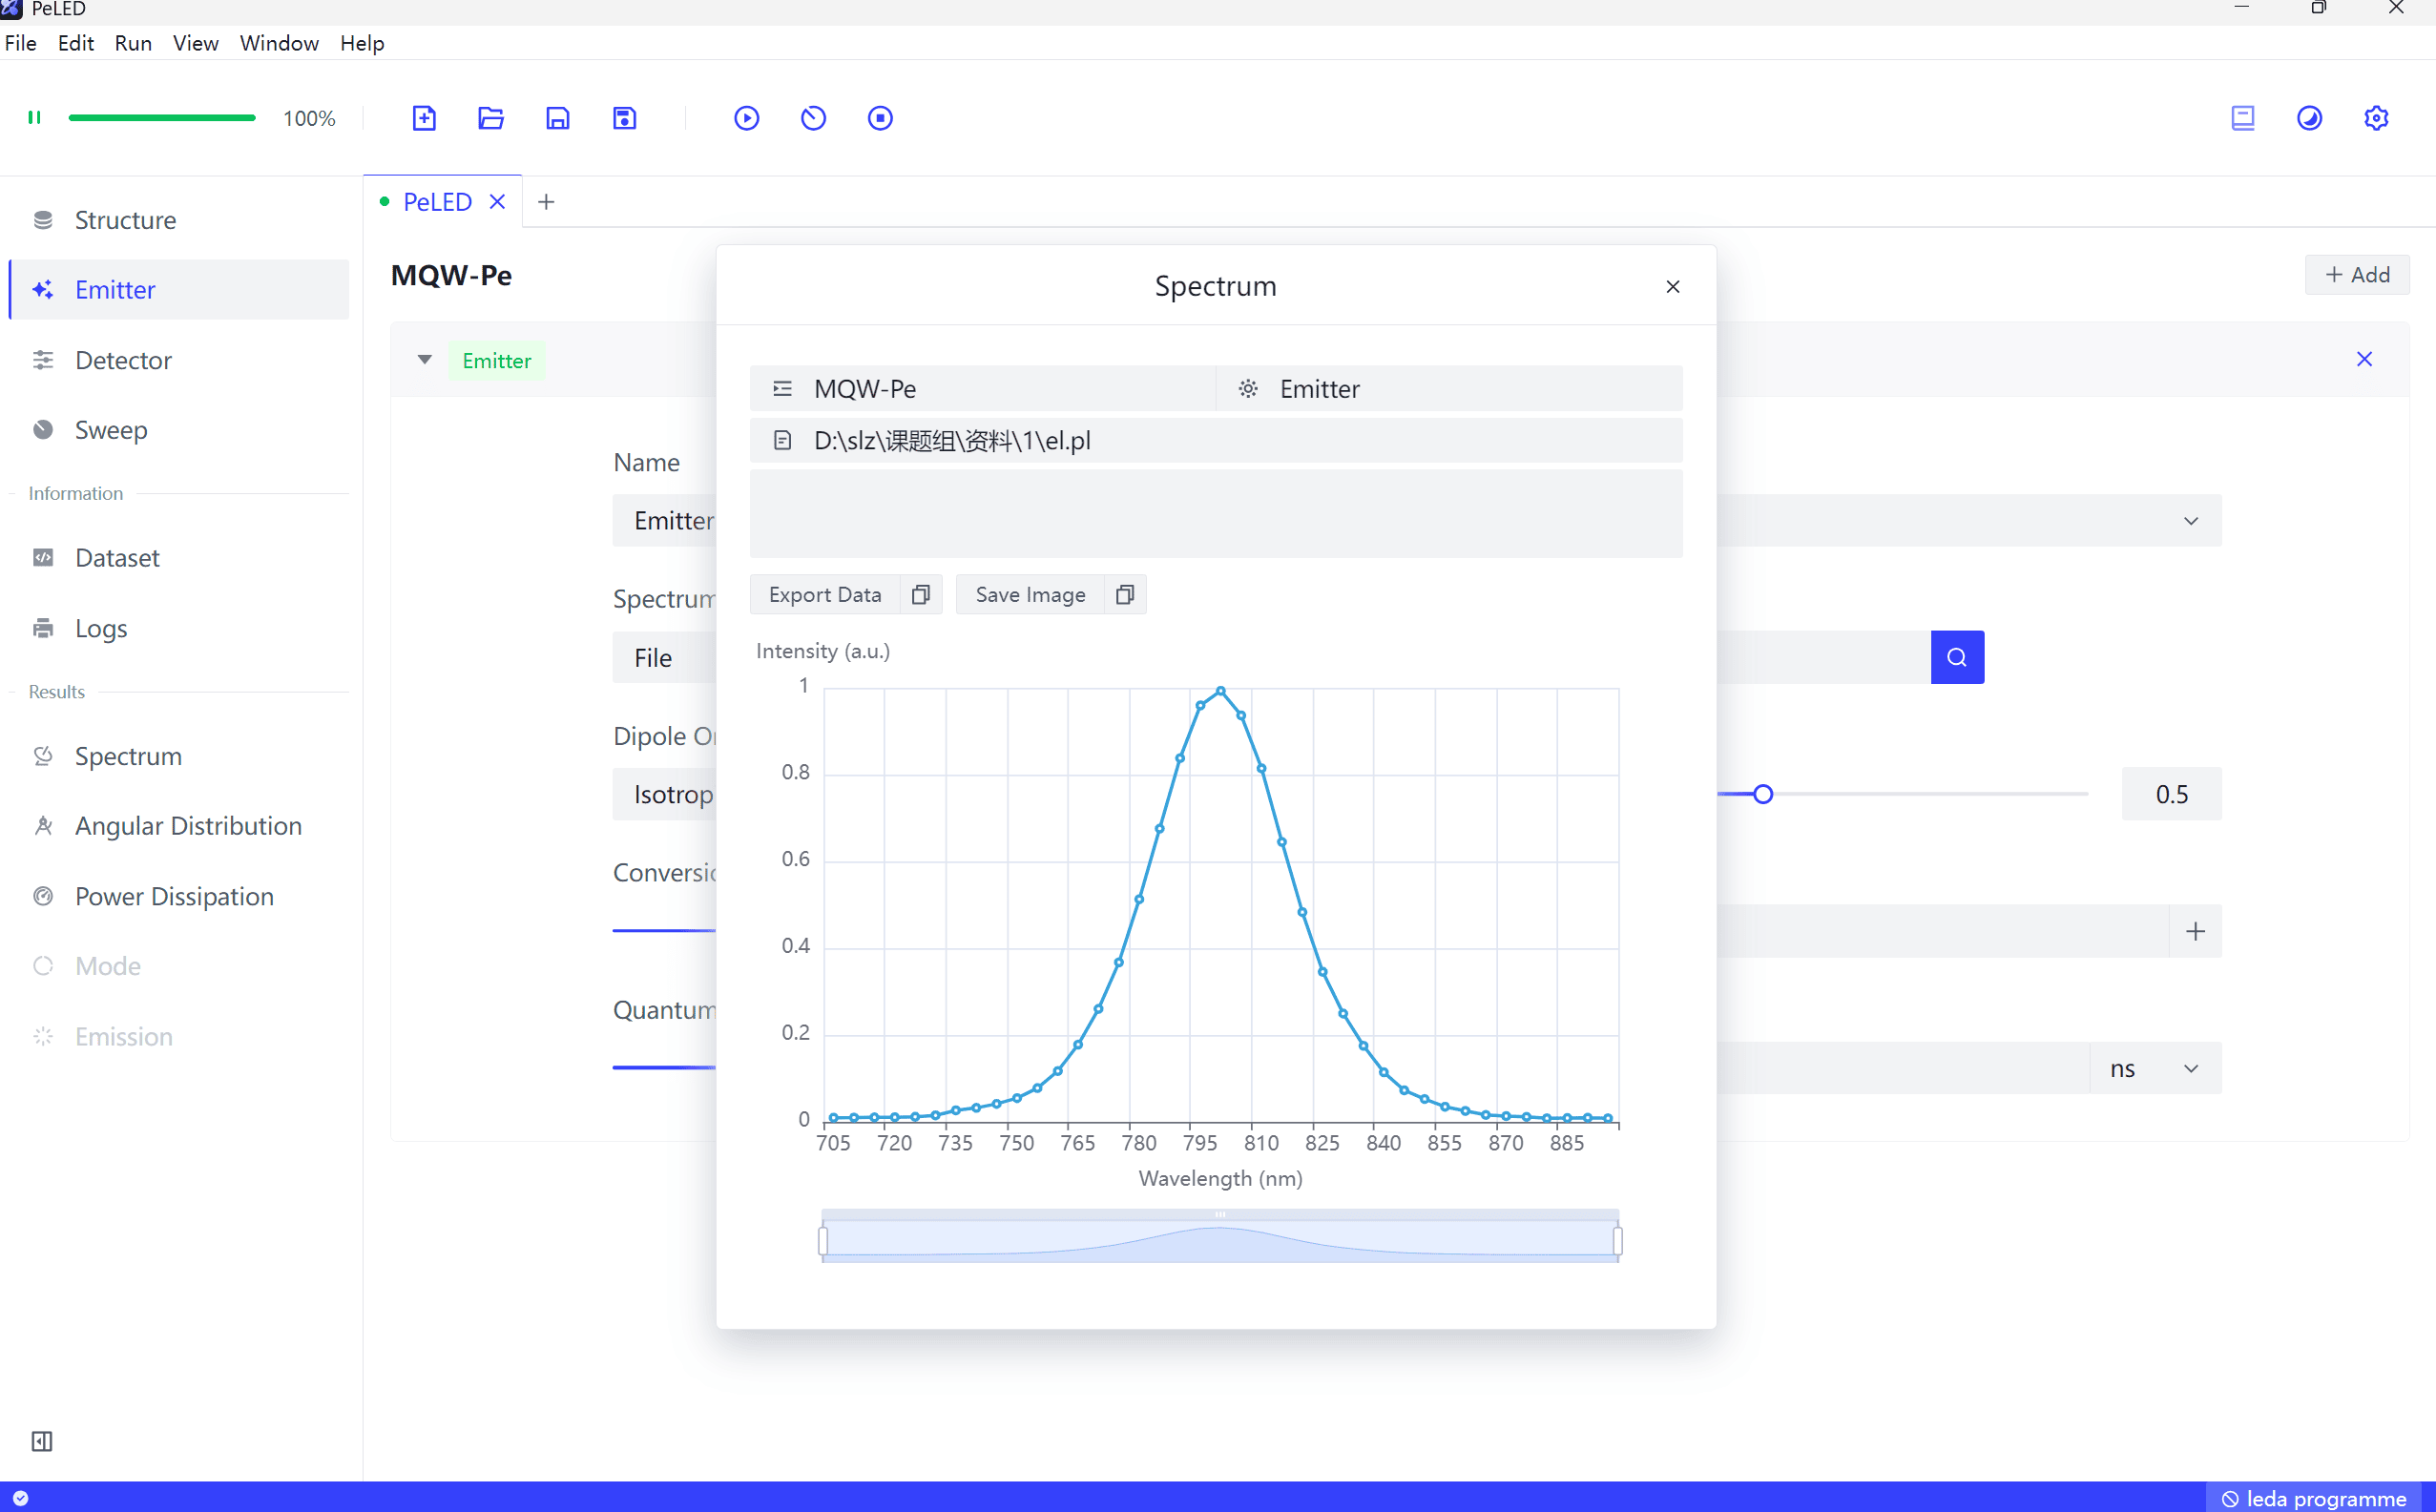
View the imported EL spectrum, which has an effective wavelength range of 725 to 875 nm.
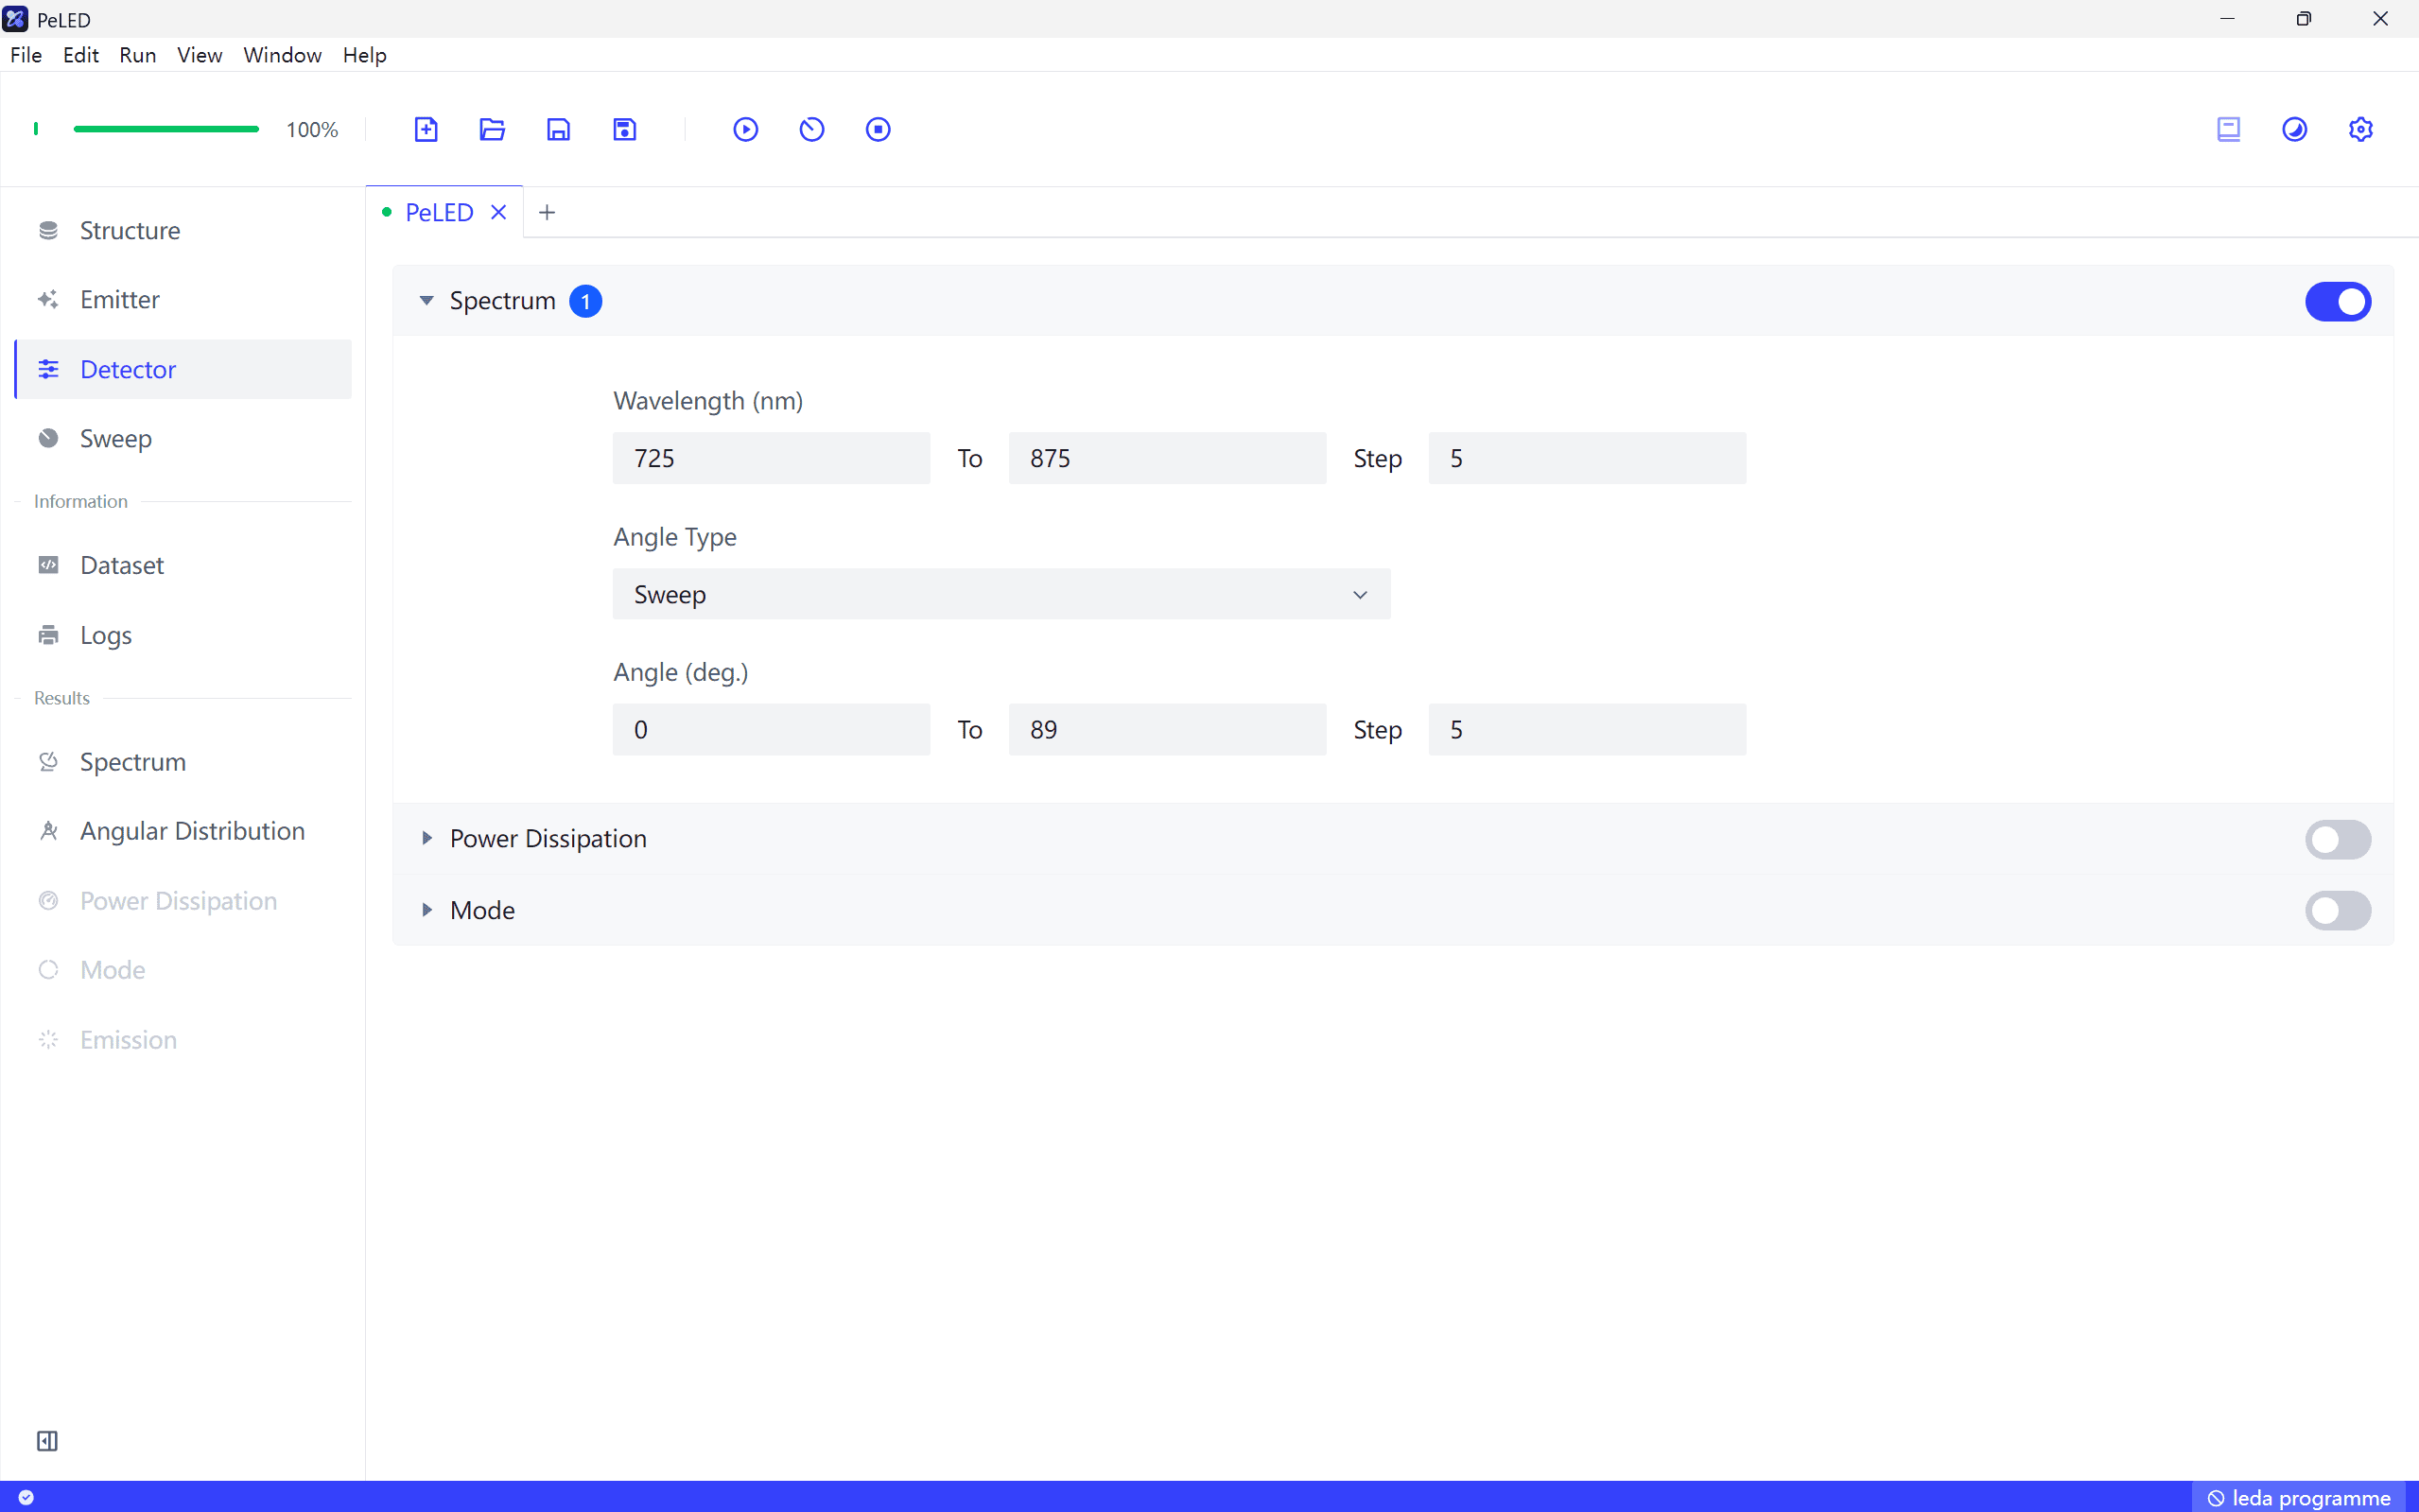
Enable the Spectrum Detector. Based on the Emitter’s spectral range, set the Wavelength range from 725 to 875 nm with a step of 5 nm. Set Angle Type to Sweep and the Angle range from 0 to 89 deg. with a step of 5 deg. (you can increase the precision for higher accuracy, but it will take longer to compute).
Click Run to output the Spectrum and Angular Dissipation results.
View the Spectrum output. First, uncheck the spectra for 0, 30, and 60 deg., then click Invert Selection to display only the spectra for 0, 30, and 60 deg. The trend is similar to Fig. 2.a, showing a blue shift as the angle increases.
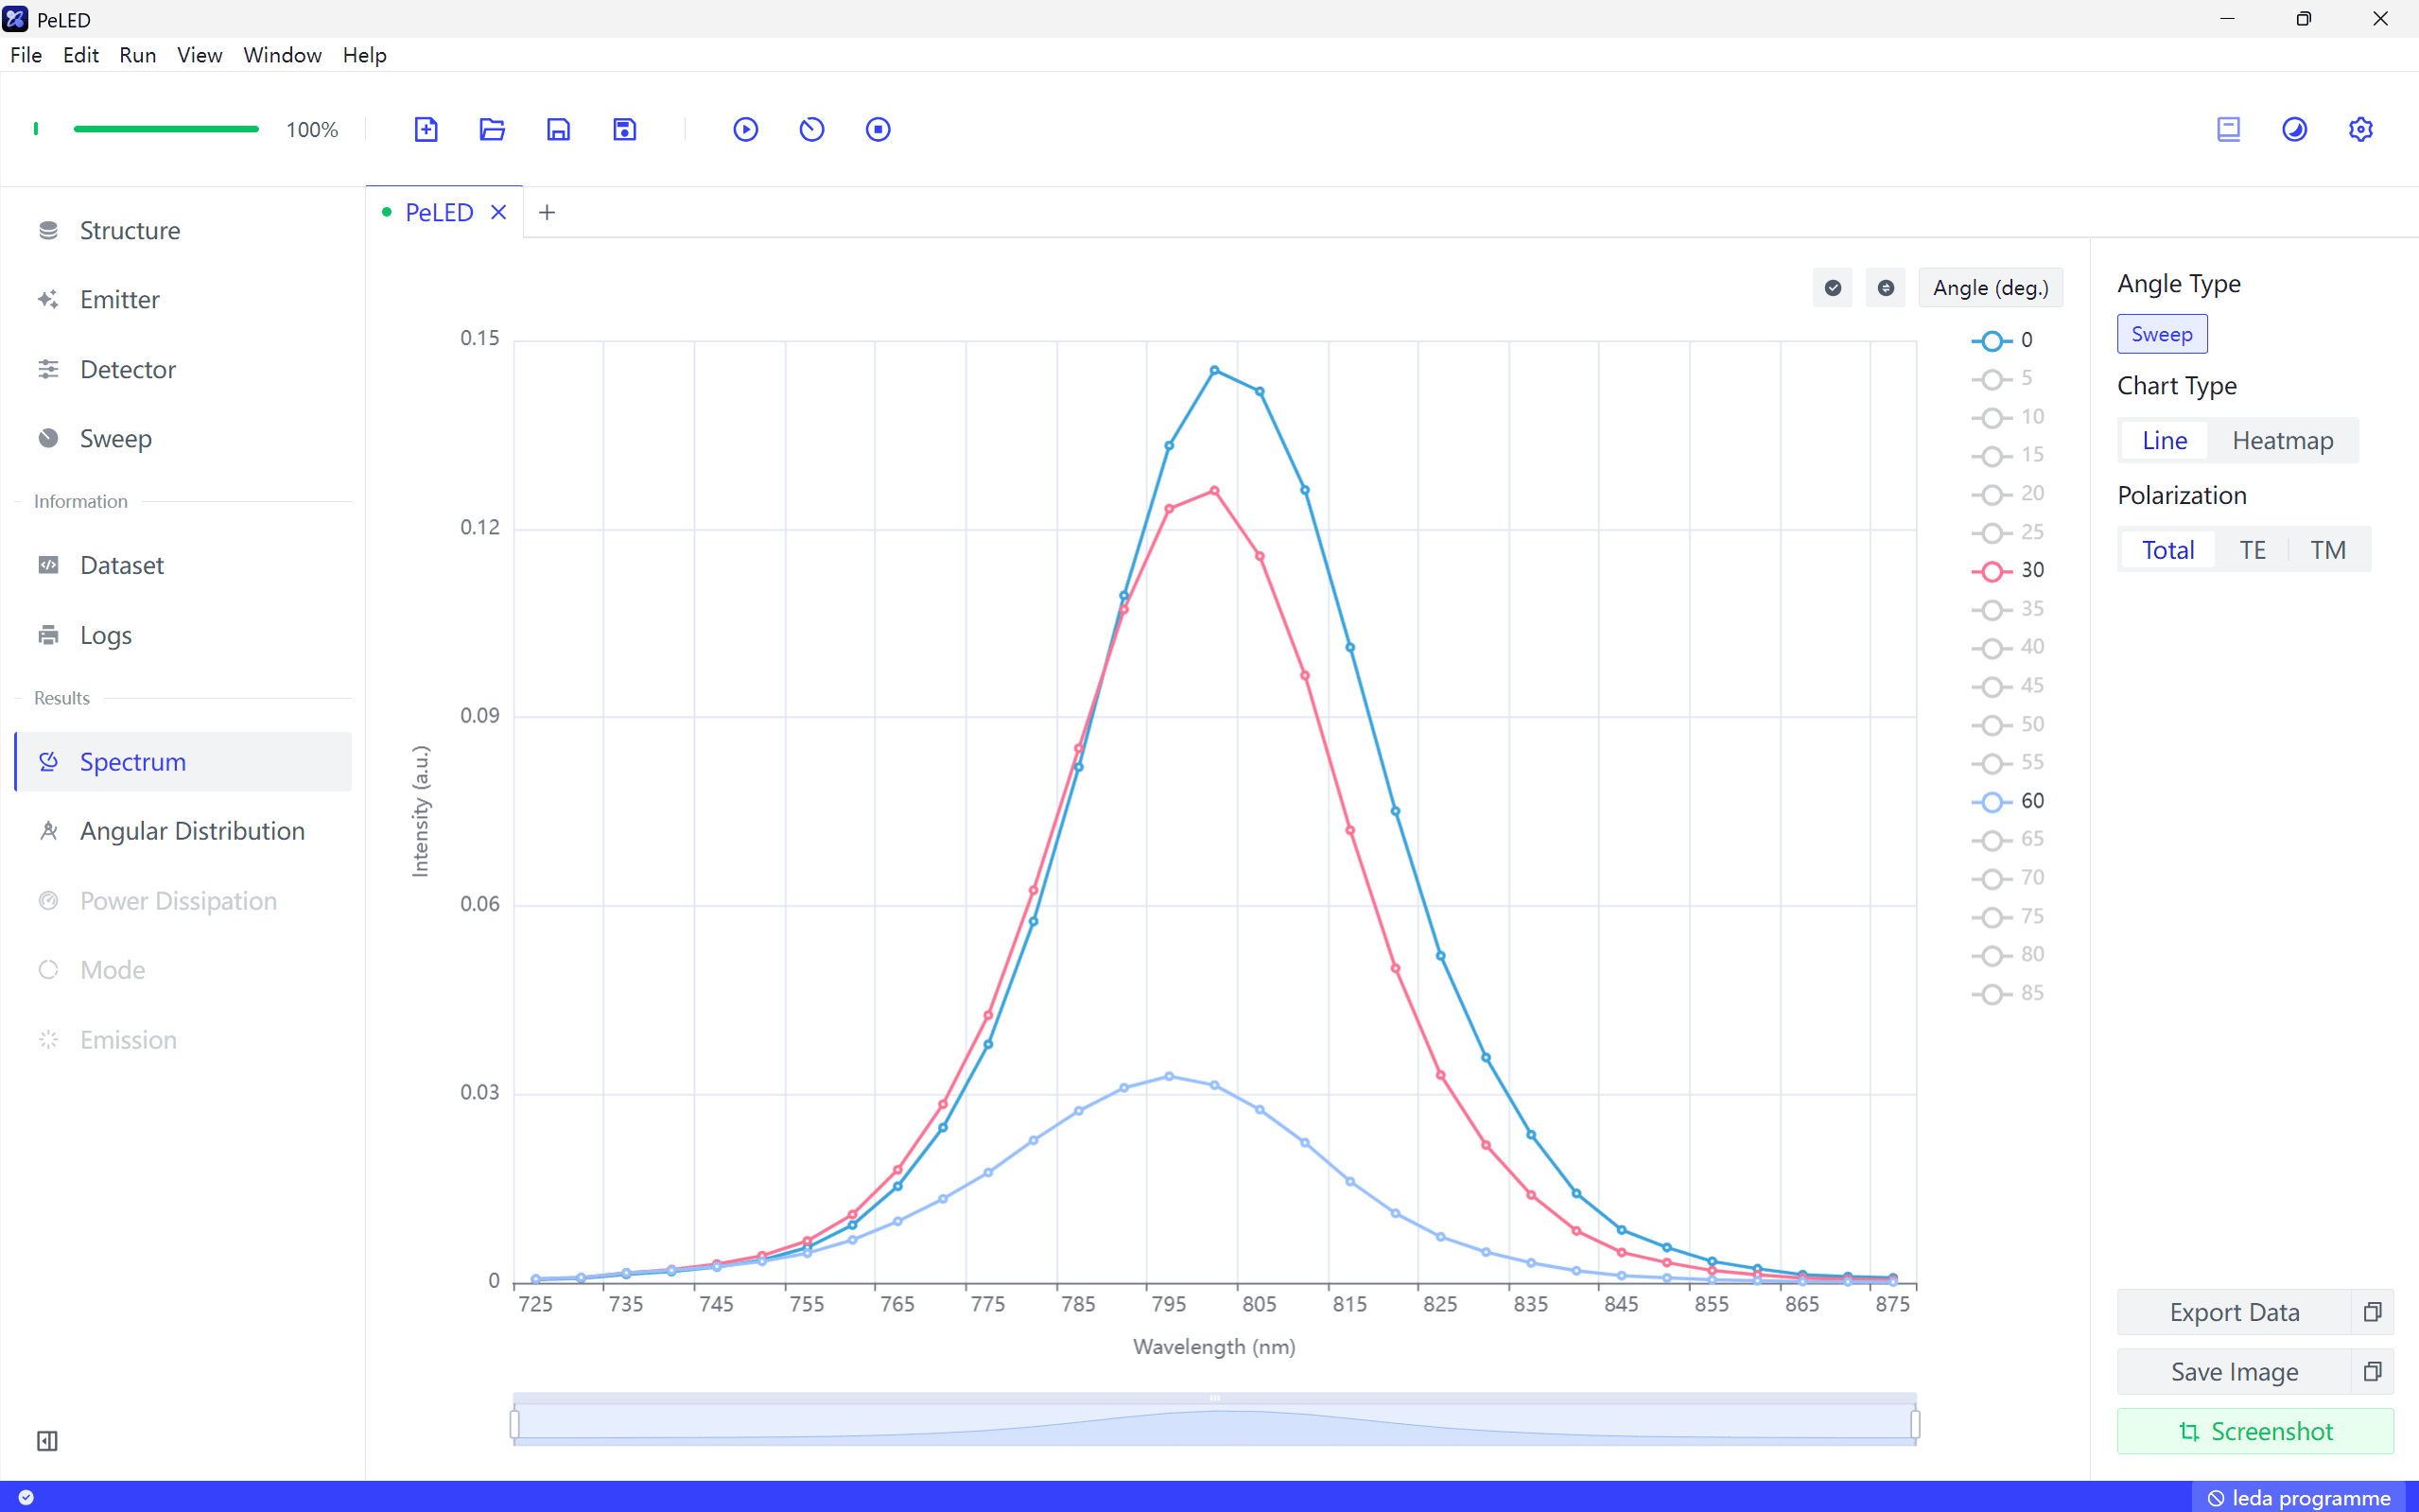
Angle-Dependent Emission Characteristics of PeLED
View the Angular Distribution output. Since there is a large variation in the intensity of different wavelengths in the EL spectrum, we need to normalize this data.
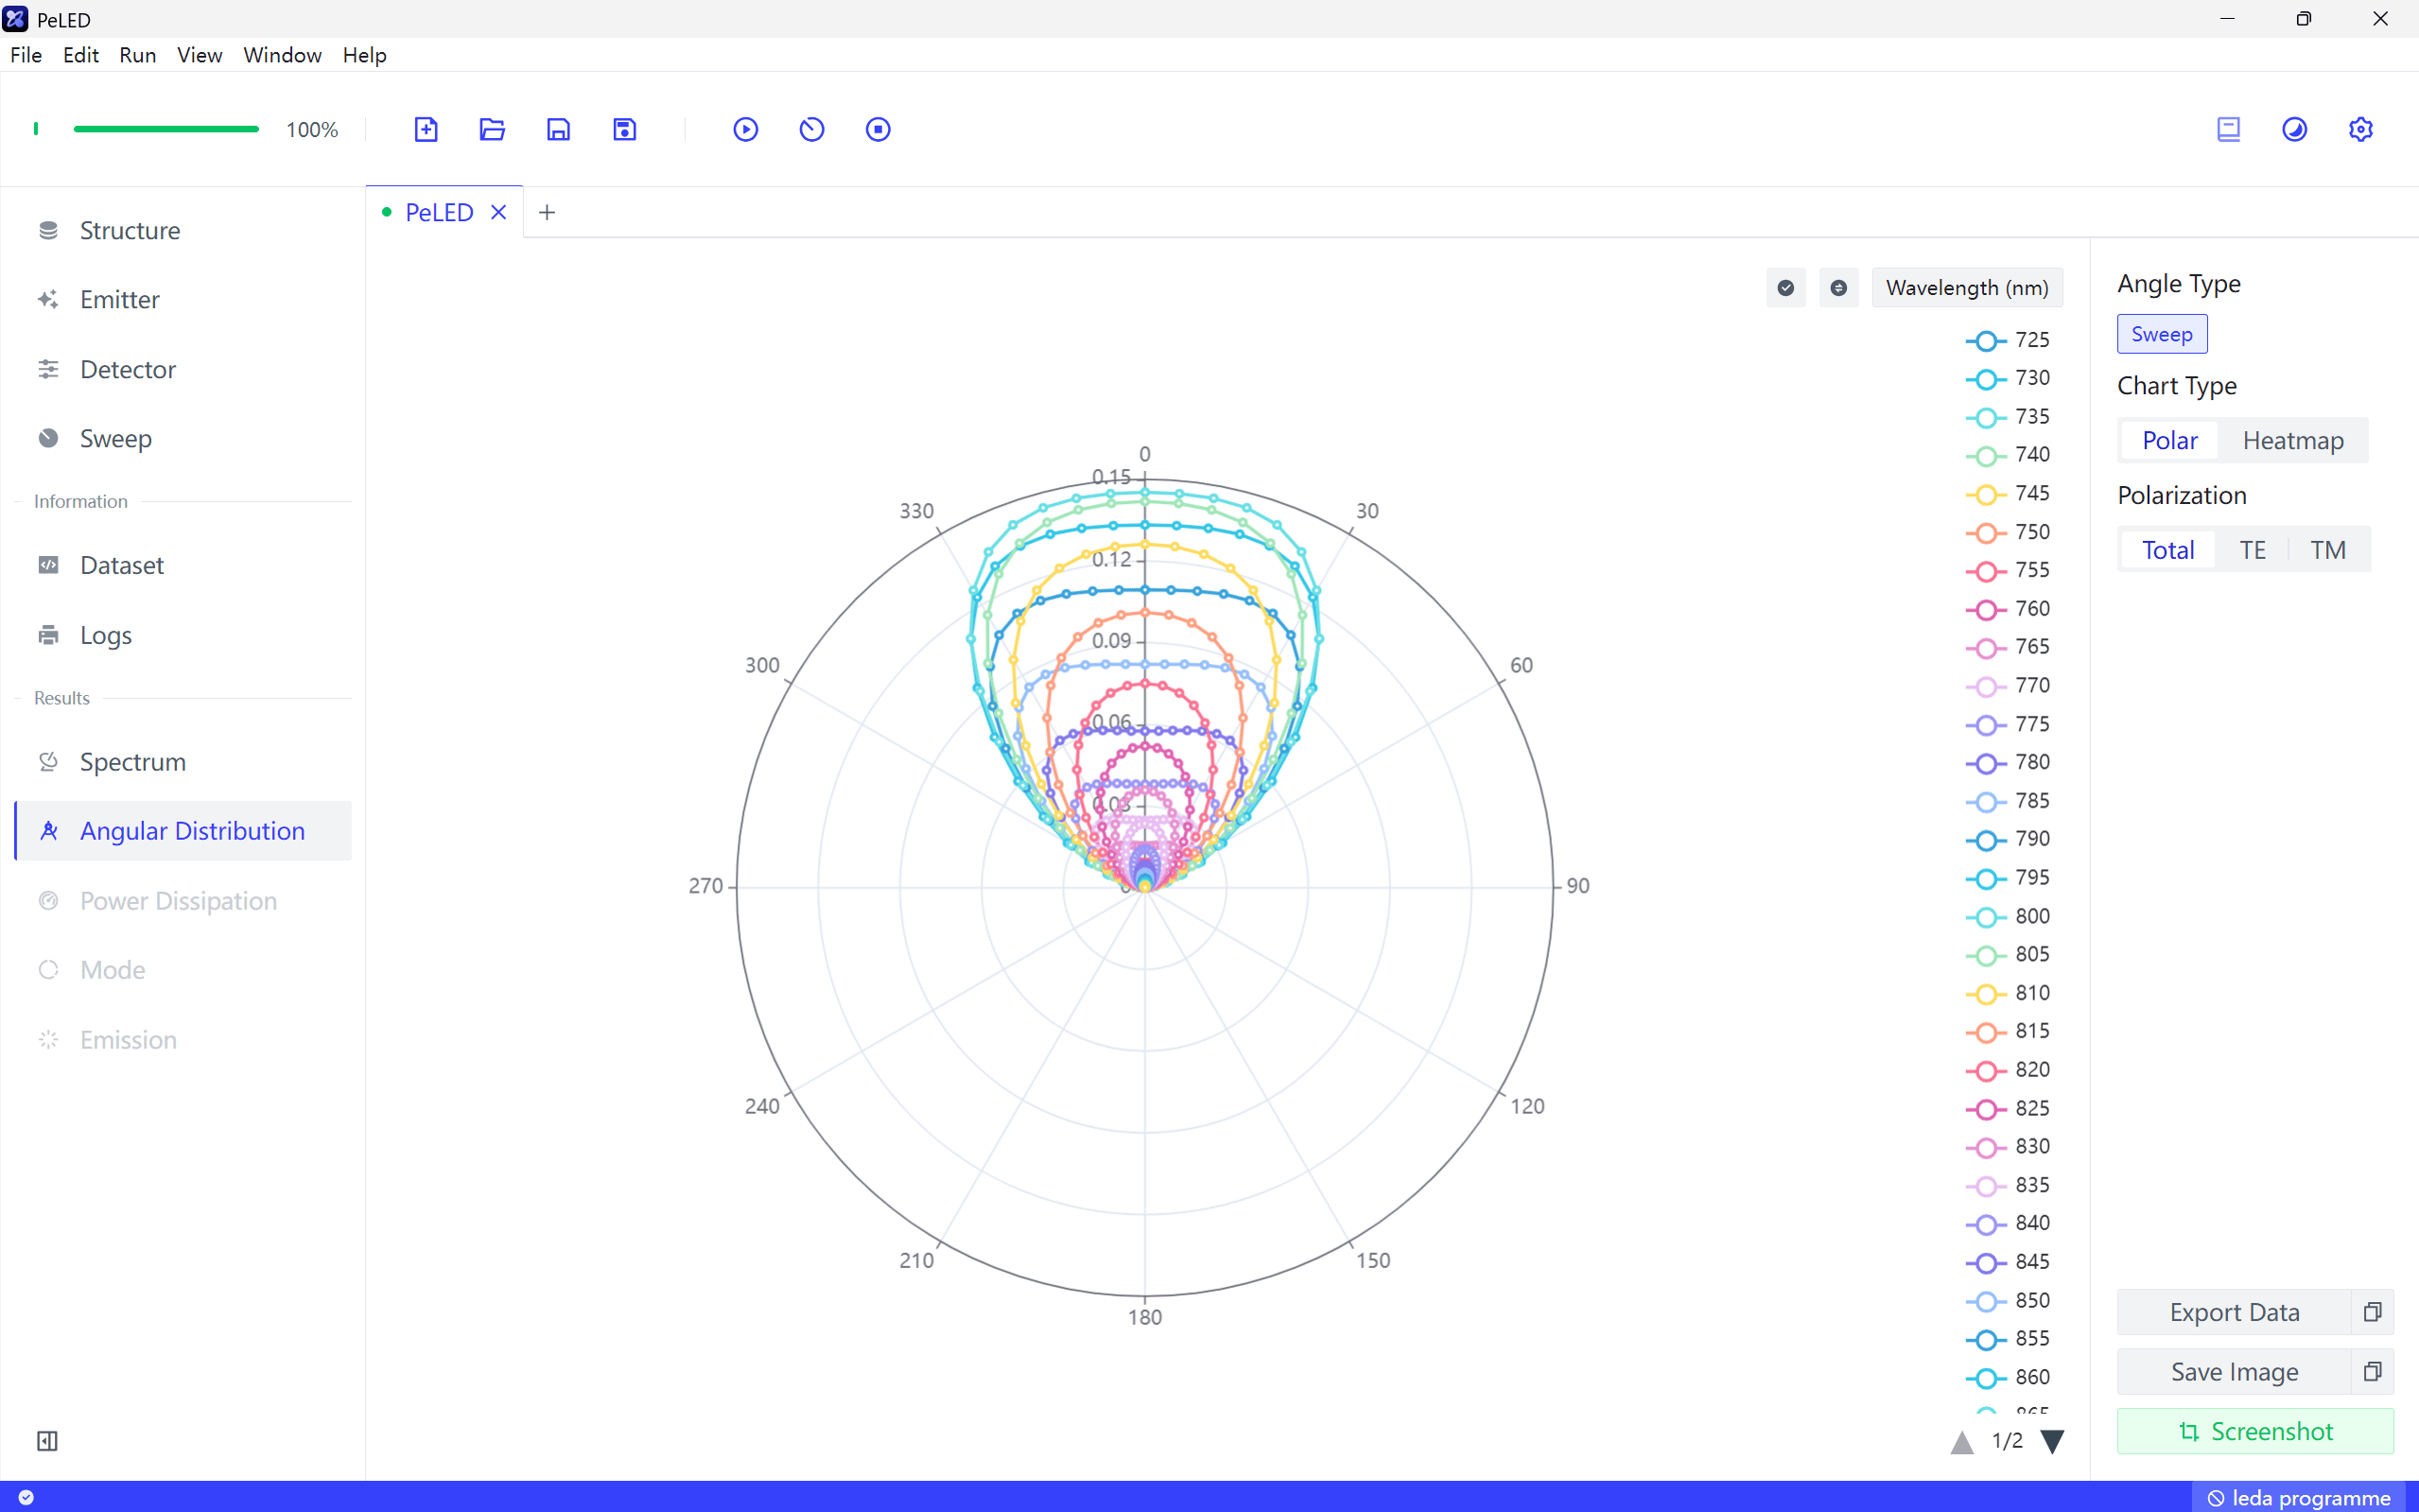
Click Export Data, copy the data to Excel, and normalize it by column.
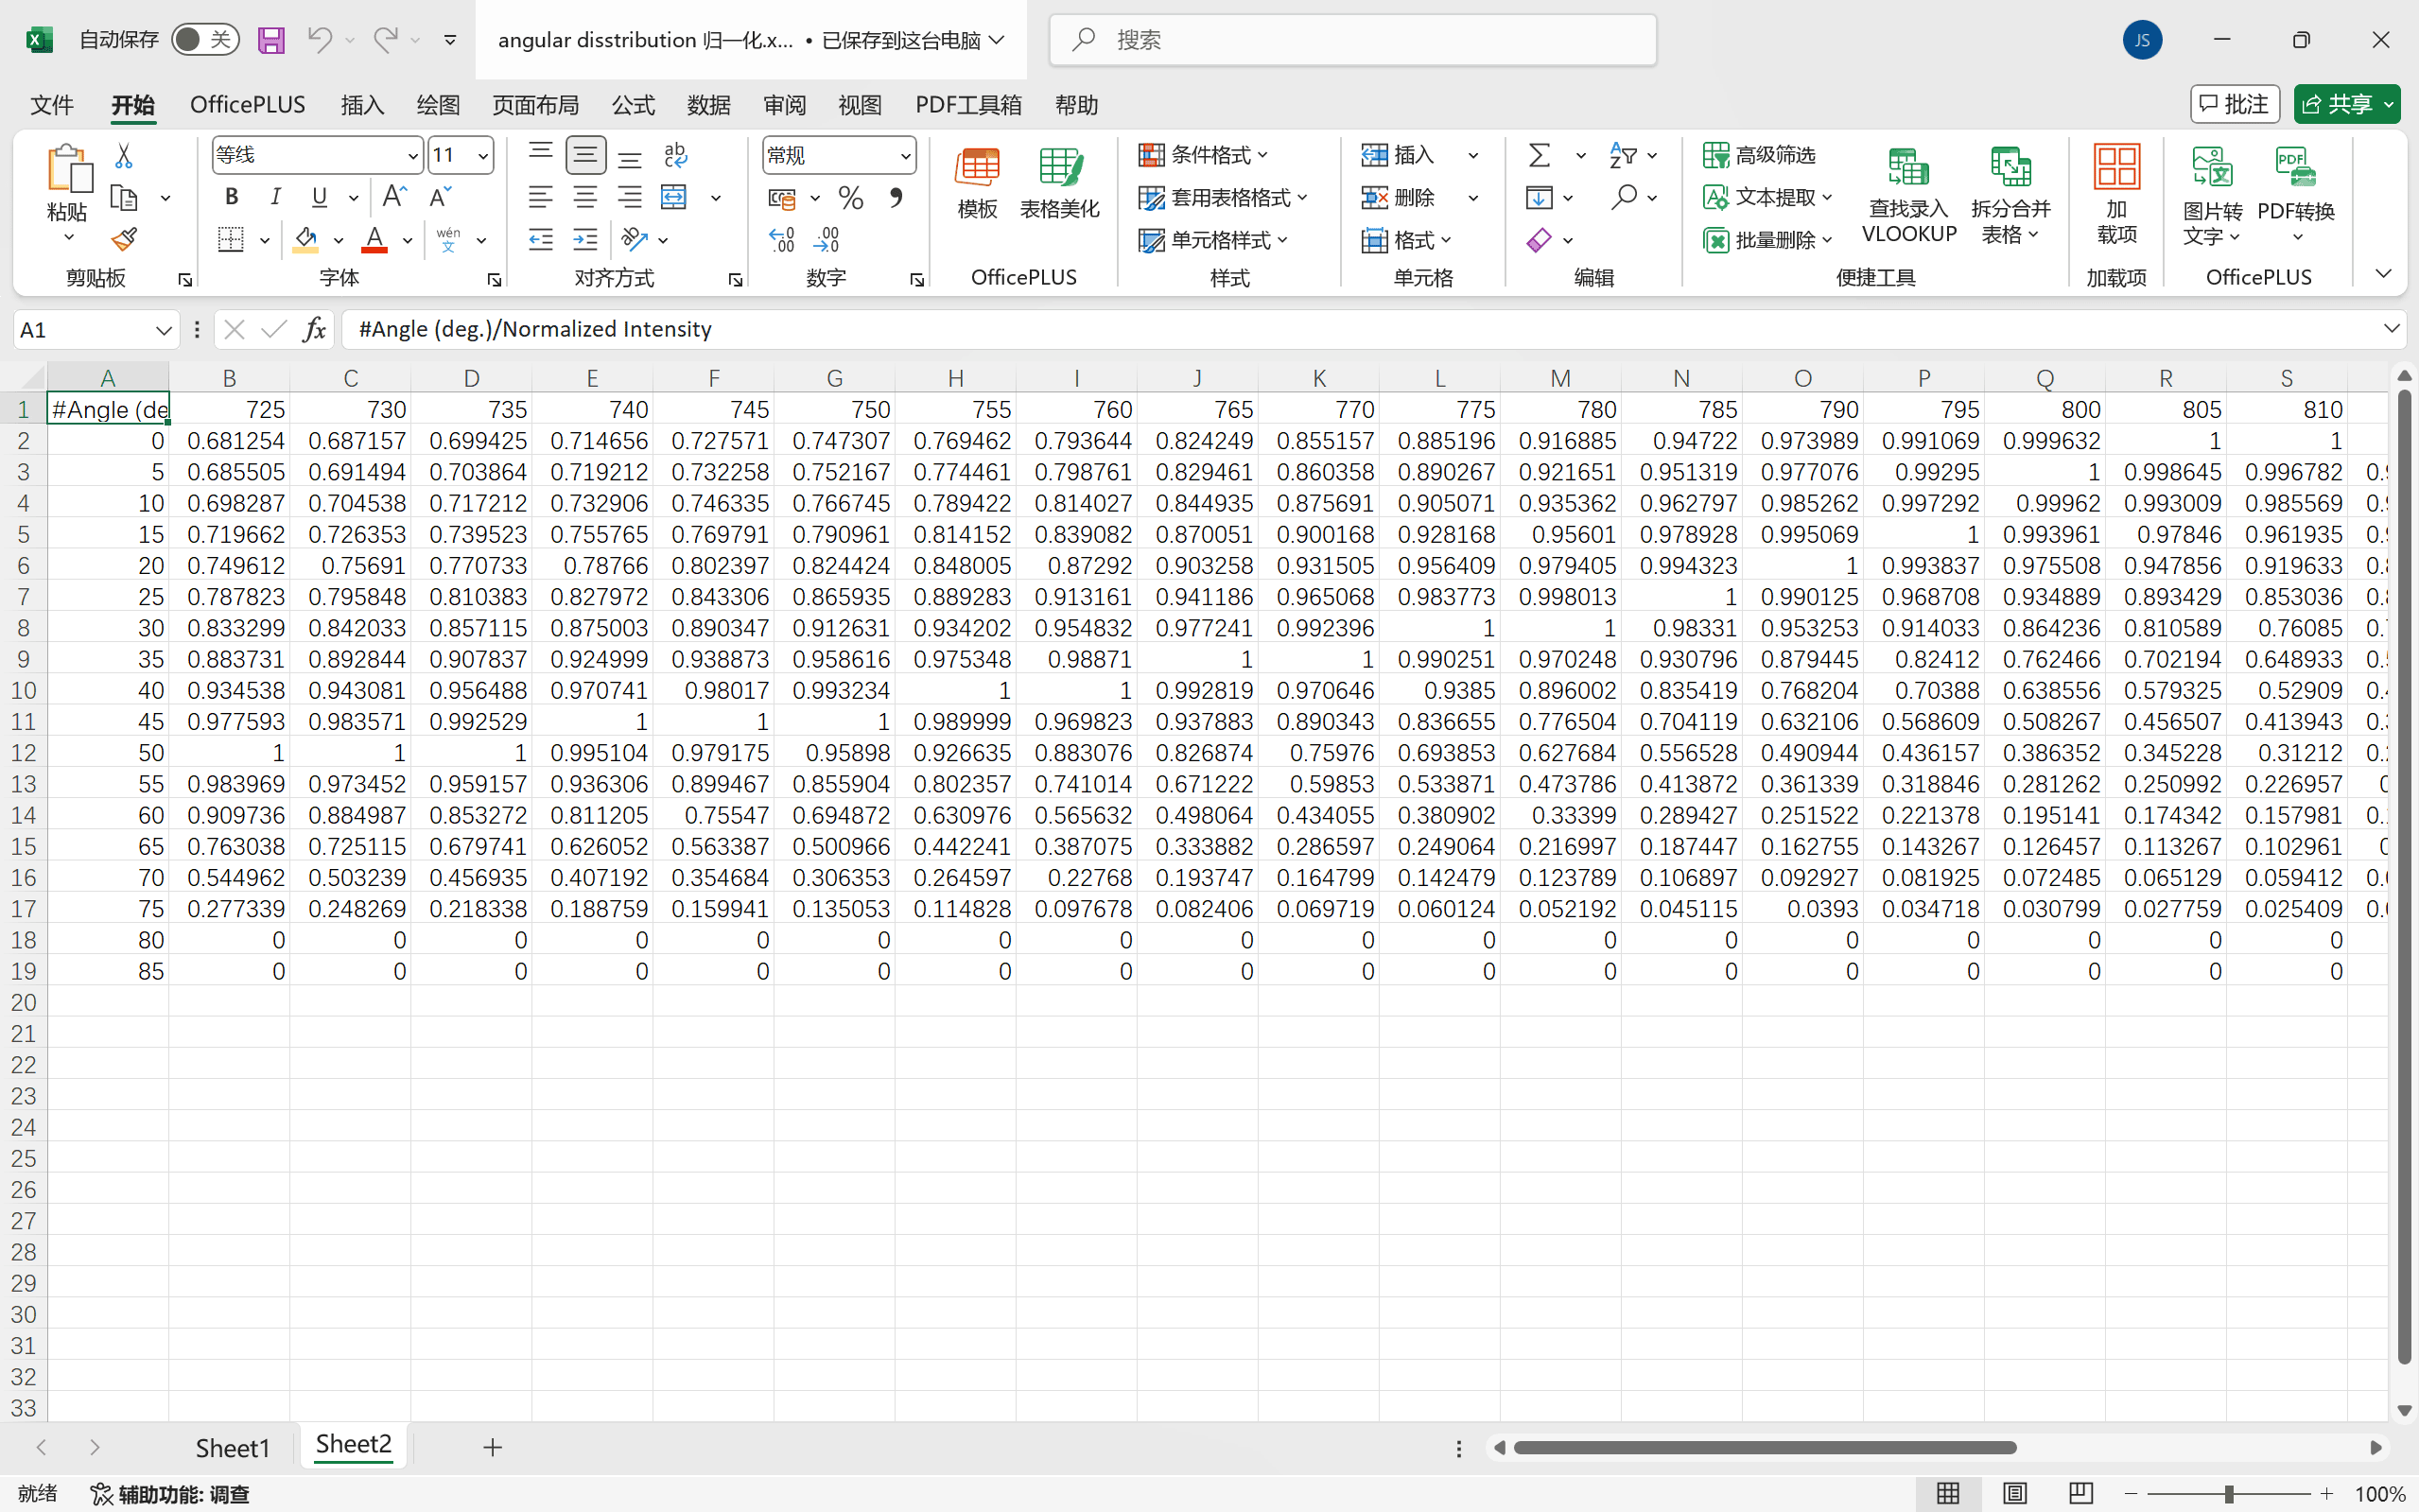
Here, we choose the Min-Max normalization method to preserve the original distribution of the data. That is:
After organizing, we get the normalized Angular Distribution data:
Then, use a plotting software (here, Origin 2024b) to process the above data, and you will get a pattern similar to Fig. 2.b.
Summary
This case study demonstrates that by constructing a Fabry-Perot microcavity structure, the LEE, EQE, and radiant exitance of perovskite light-emitting diodes can be significantly improved, and precise control of the angular distribution can be achieved.
Back