
Refractive Index
Highly Efficient Top-Emitting QLED
Highly Efficient Top-Emitting Quantum-Dot Light-Emitting Diodes with Record-Breaking External Quantum Efficiency of over 44.5% Haotao Li, Shiming Zhou, Shuming Chen*
Highlights
This study demonstrates the advantages of top-emitting (TE) QLEDs over bottom-emitting (BE) QLEDs in terms of light extraction efficiency (LEE). By simultaneously optimizing the thicknesses of both indium-zinc-oxide (IZO) phase tuning layers (PTLs) and IZO top transparent electrodes, the LEE exceeded 45%. This optimization ultimately achieved an external quantum efficiency (EQE) of 44.5%, representing the highest reported efficiency for QLEDs at the time of publication.
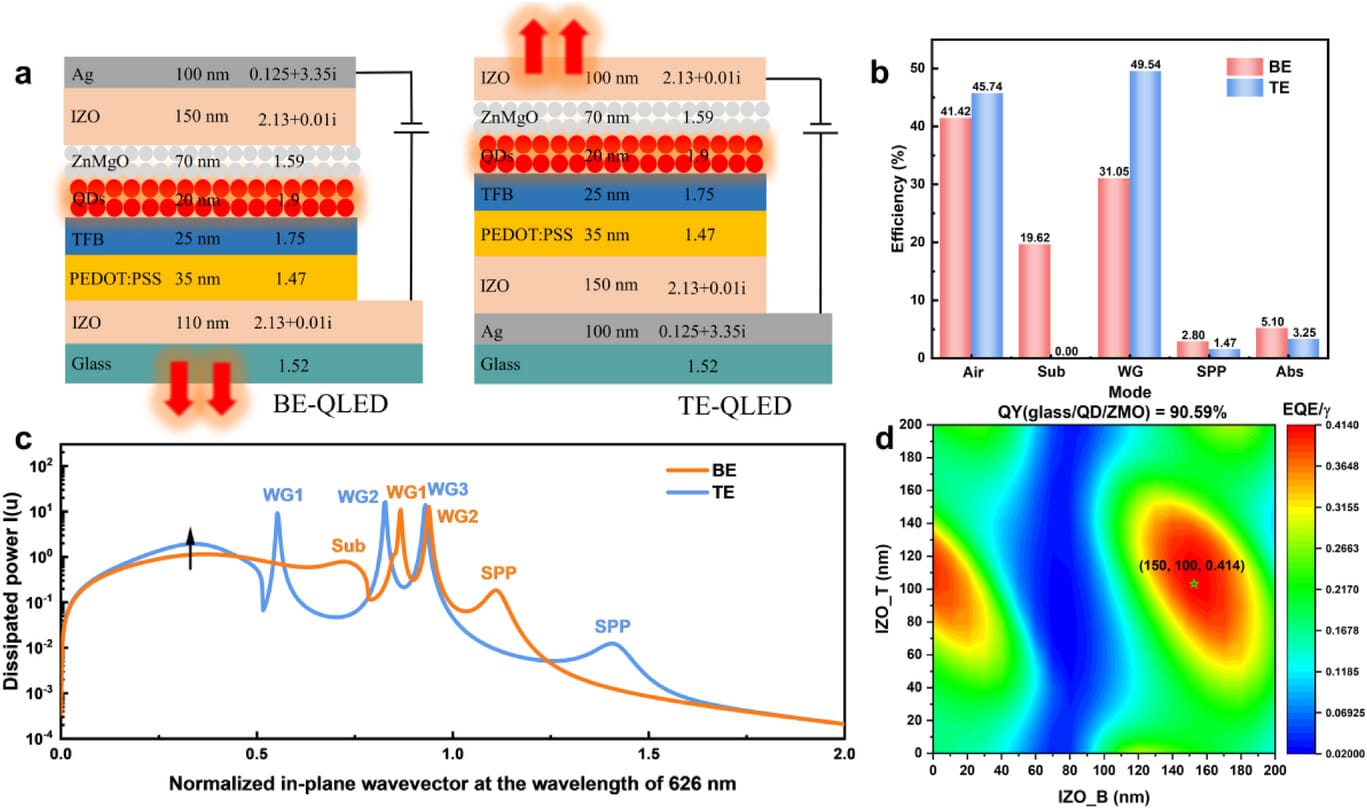
Figure 1. (a) The schematic device structure of BE-QLED and TE-QLED and the parameters for simulation at a wavelength of 626 nm. (b) Coupling efficiency of each mode of the devices based on BE and TE structures. (c) Power dissipation spectra of BE-QLED and TE-QLED at the wavelength of 626 nm in optimal structure. (d) The averaged EQE/γ as a function of the thicknesses of both bottom and top IZO PTLs.
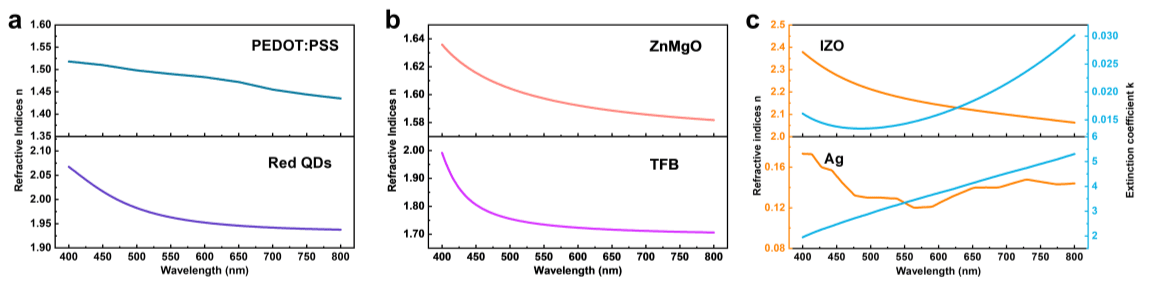
Figure S1. Optical properties of the functional layers. (a, b) The wavelengthdependent refractive indices of QDs and CTLs. (c) The wavelength-dependent refractive indices and extinction coefficient of electrodes.
Preparation
Install and activate Leda properly according to Installation and Licensing.
Download the following data files to your local machine.
Spectrum
These data files are provided solely for this case study. For use in actual projects, please cite: Li et al., 2023
Simulation Validation
Let’s use Leda to reproduce the simulation results shown in Figure 1.
Optical Loss Analysis
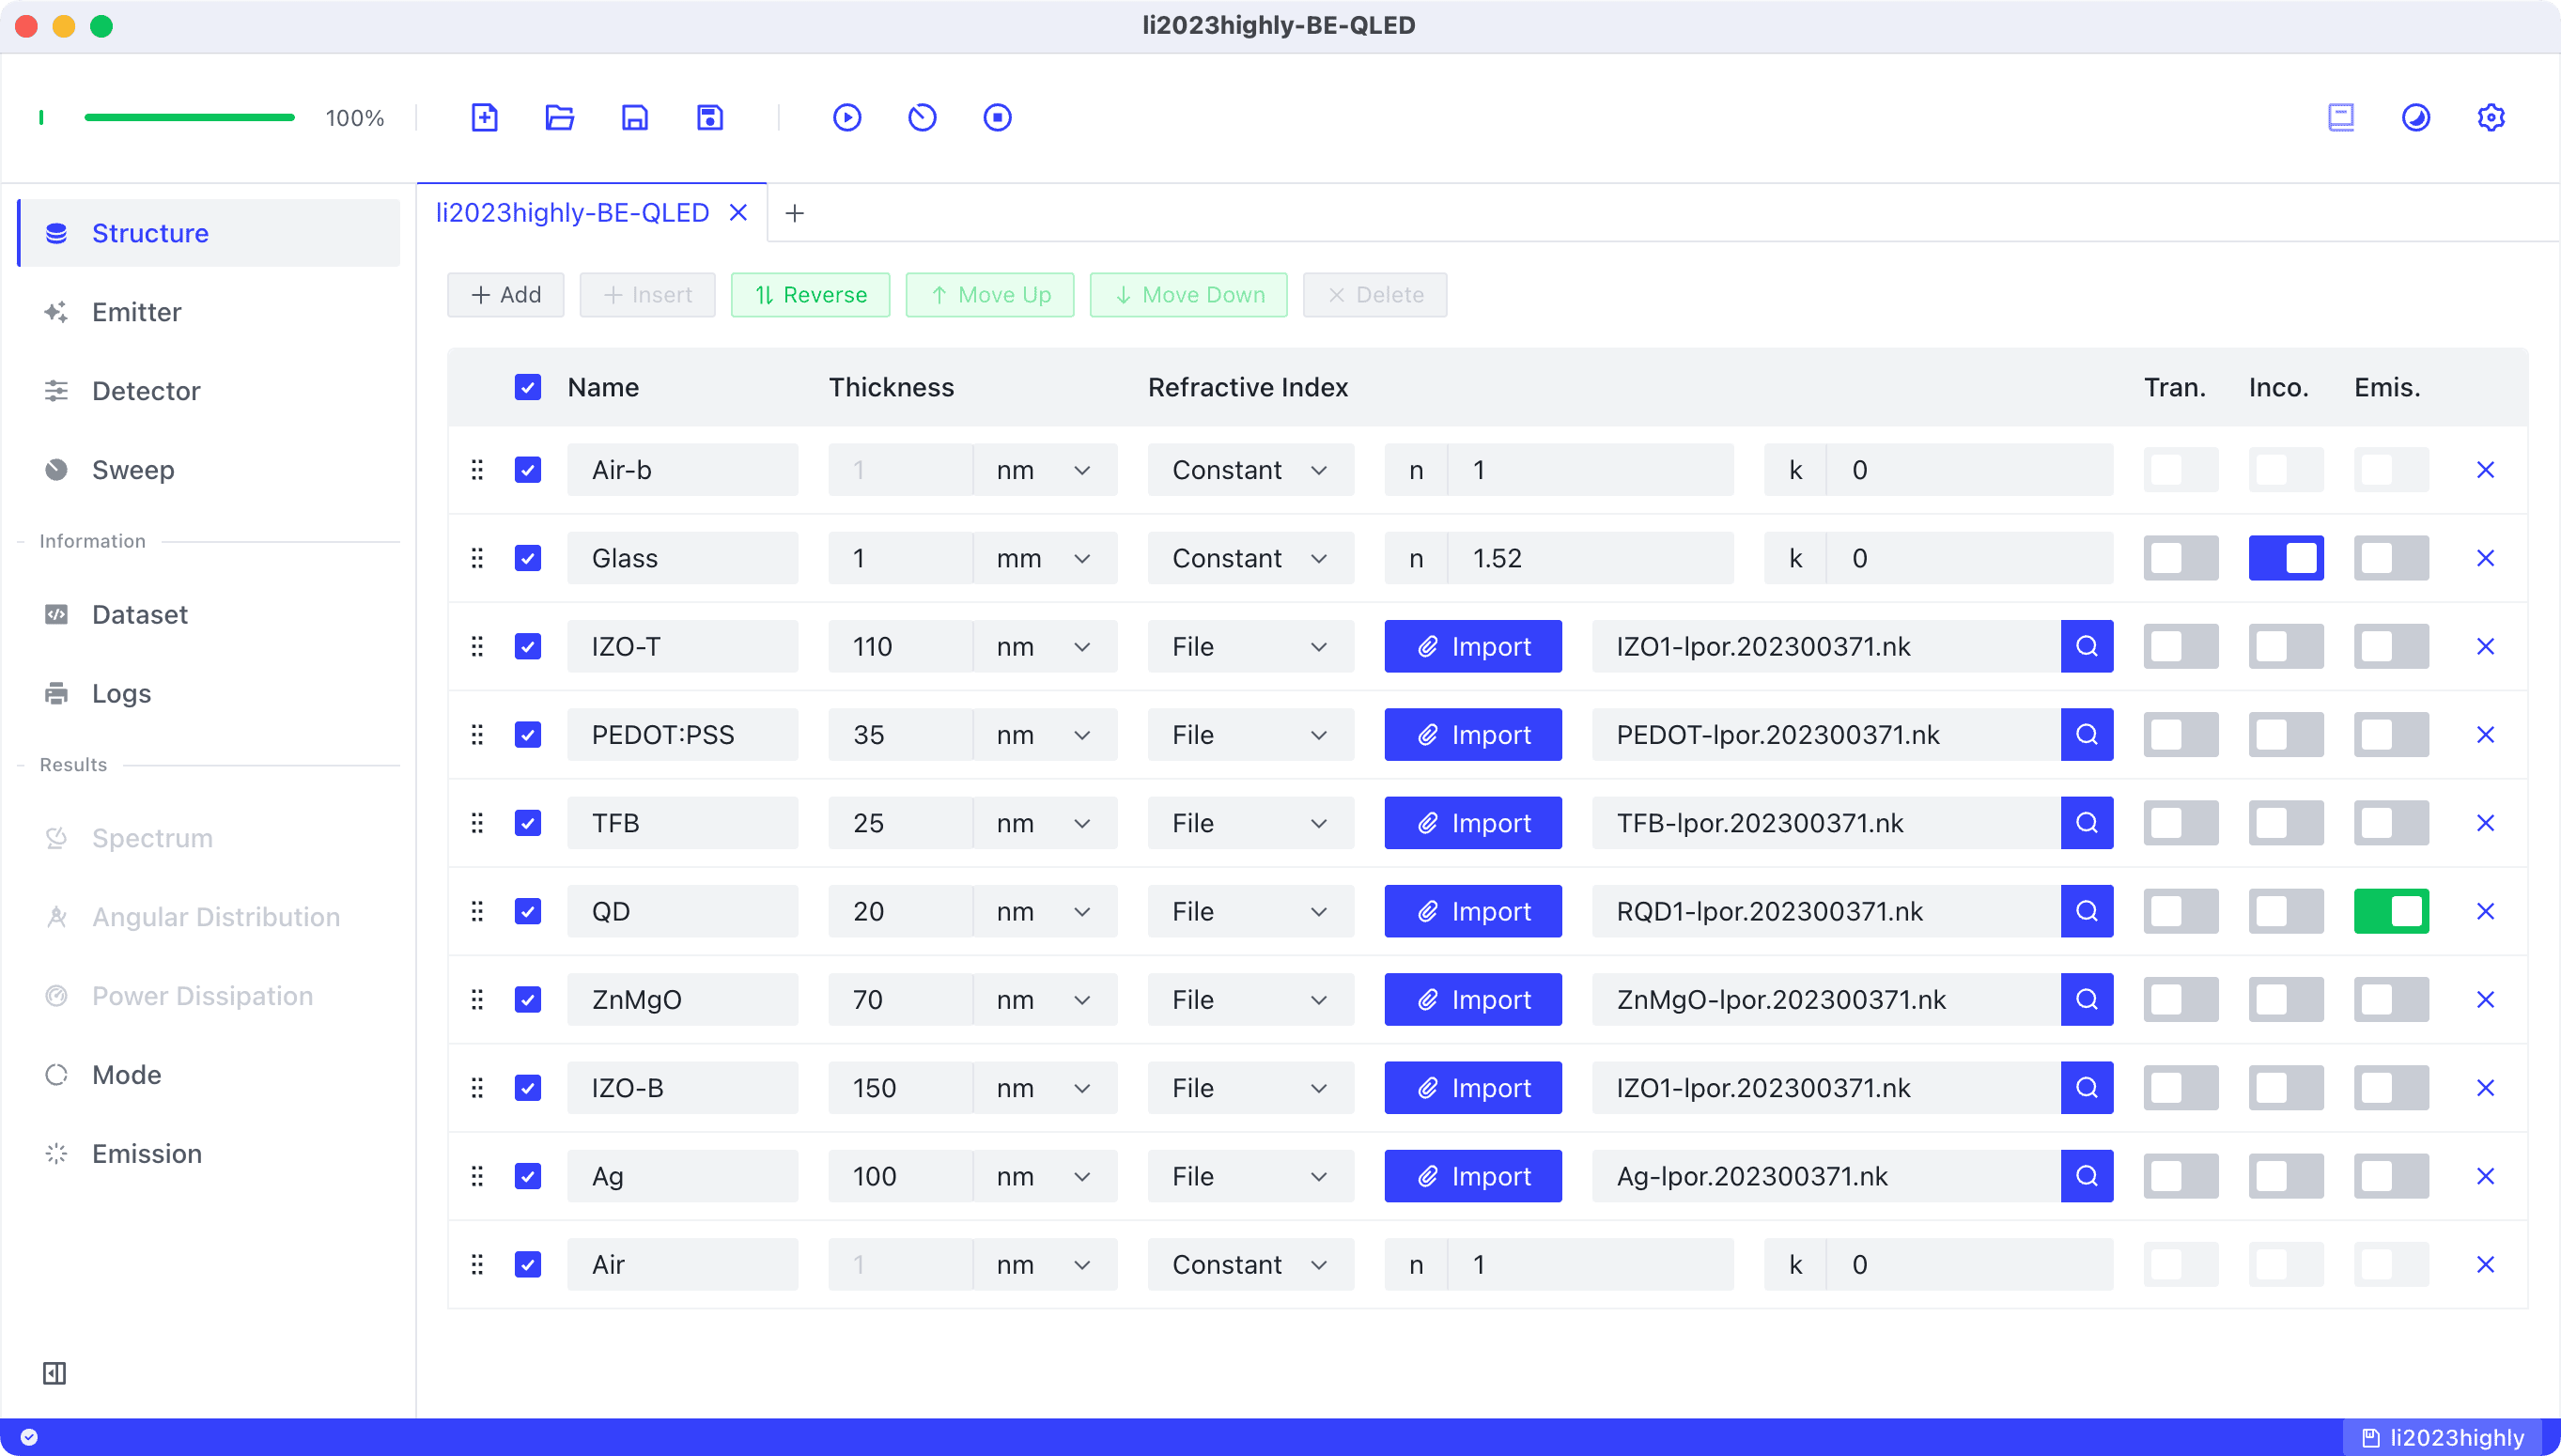
First, we establish the BE-QLED structure according to Figure 1(a), importing the refractive index data provided by the authors for each layer. We activate the Emis. property of the QD layer to designate it as the EML, and enable the Inco. property for the glass since it serves as the substrate.
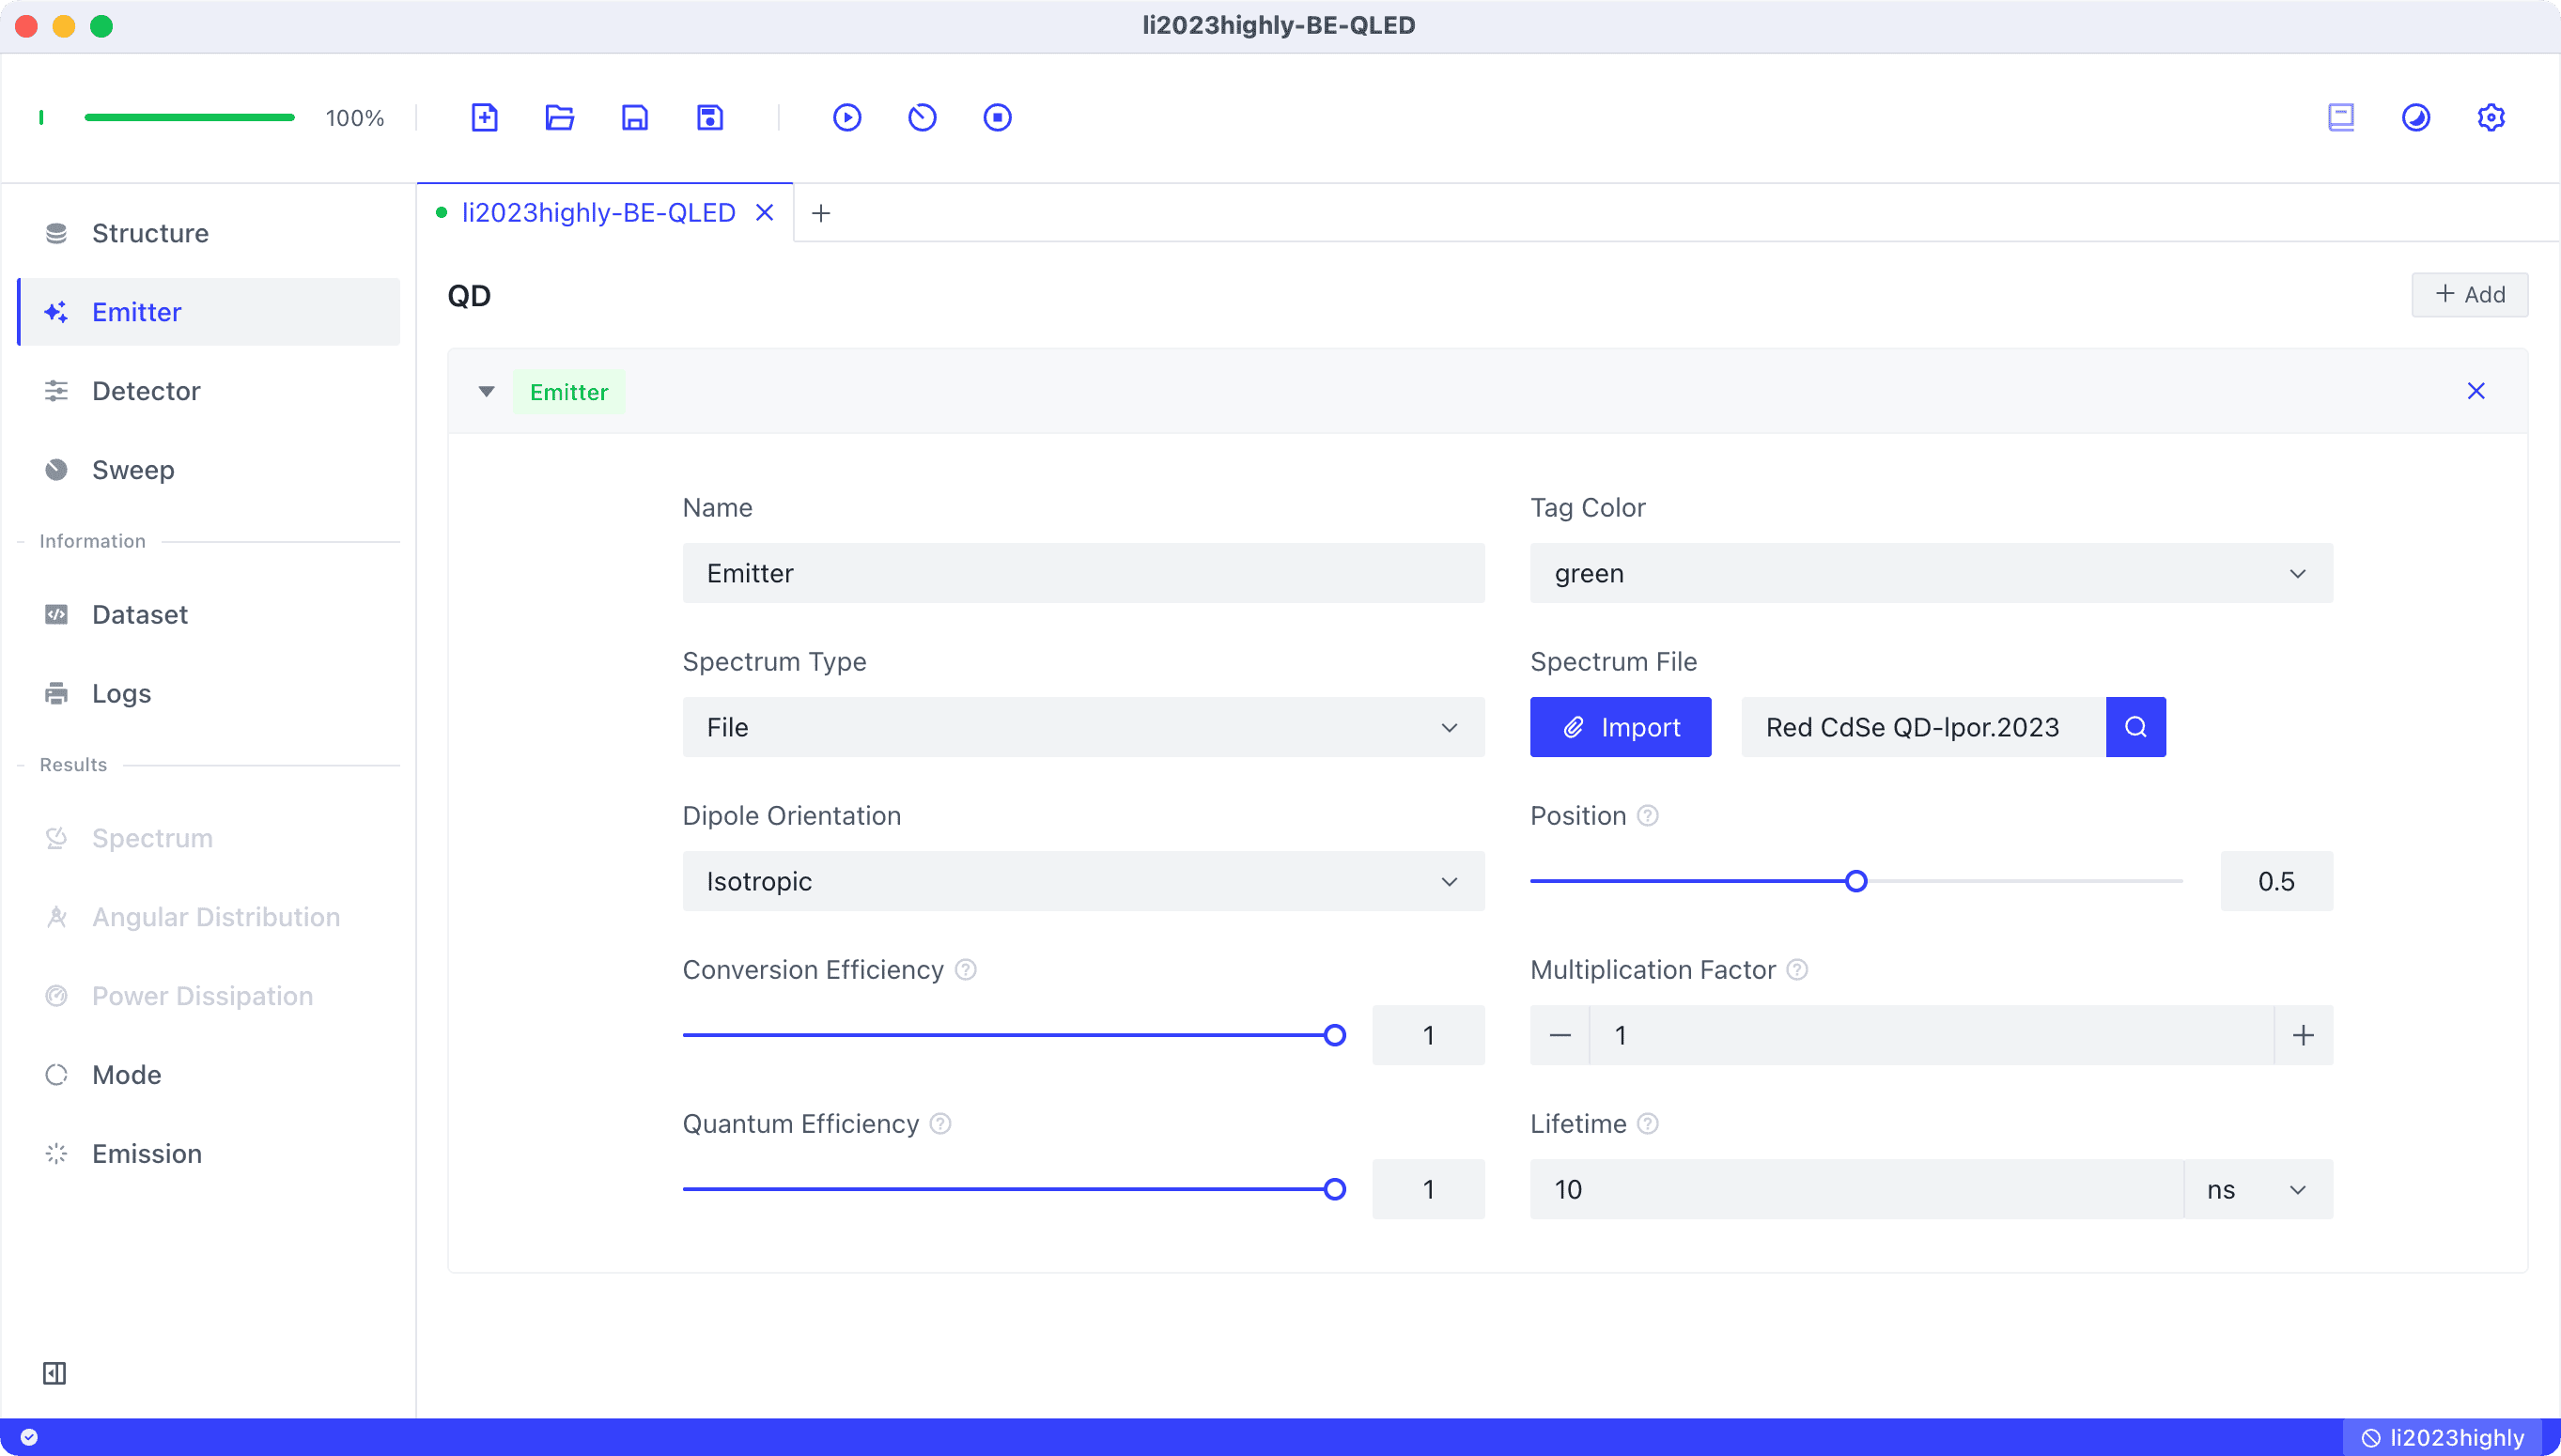
In the Emitter configurations, we import the PL spectrum of the Red CdSe QD provided by the authors.
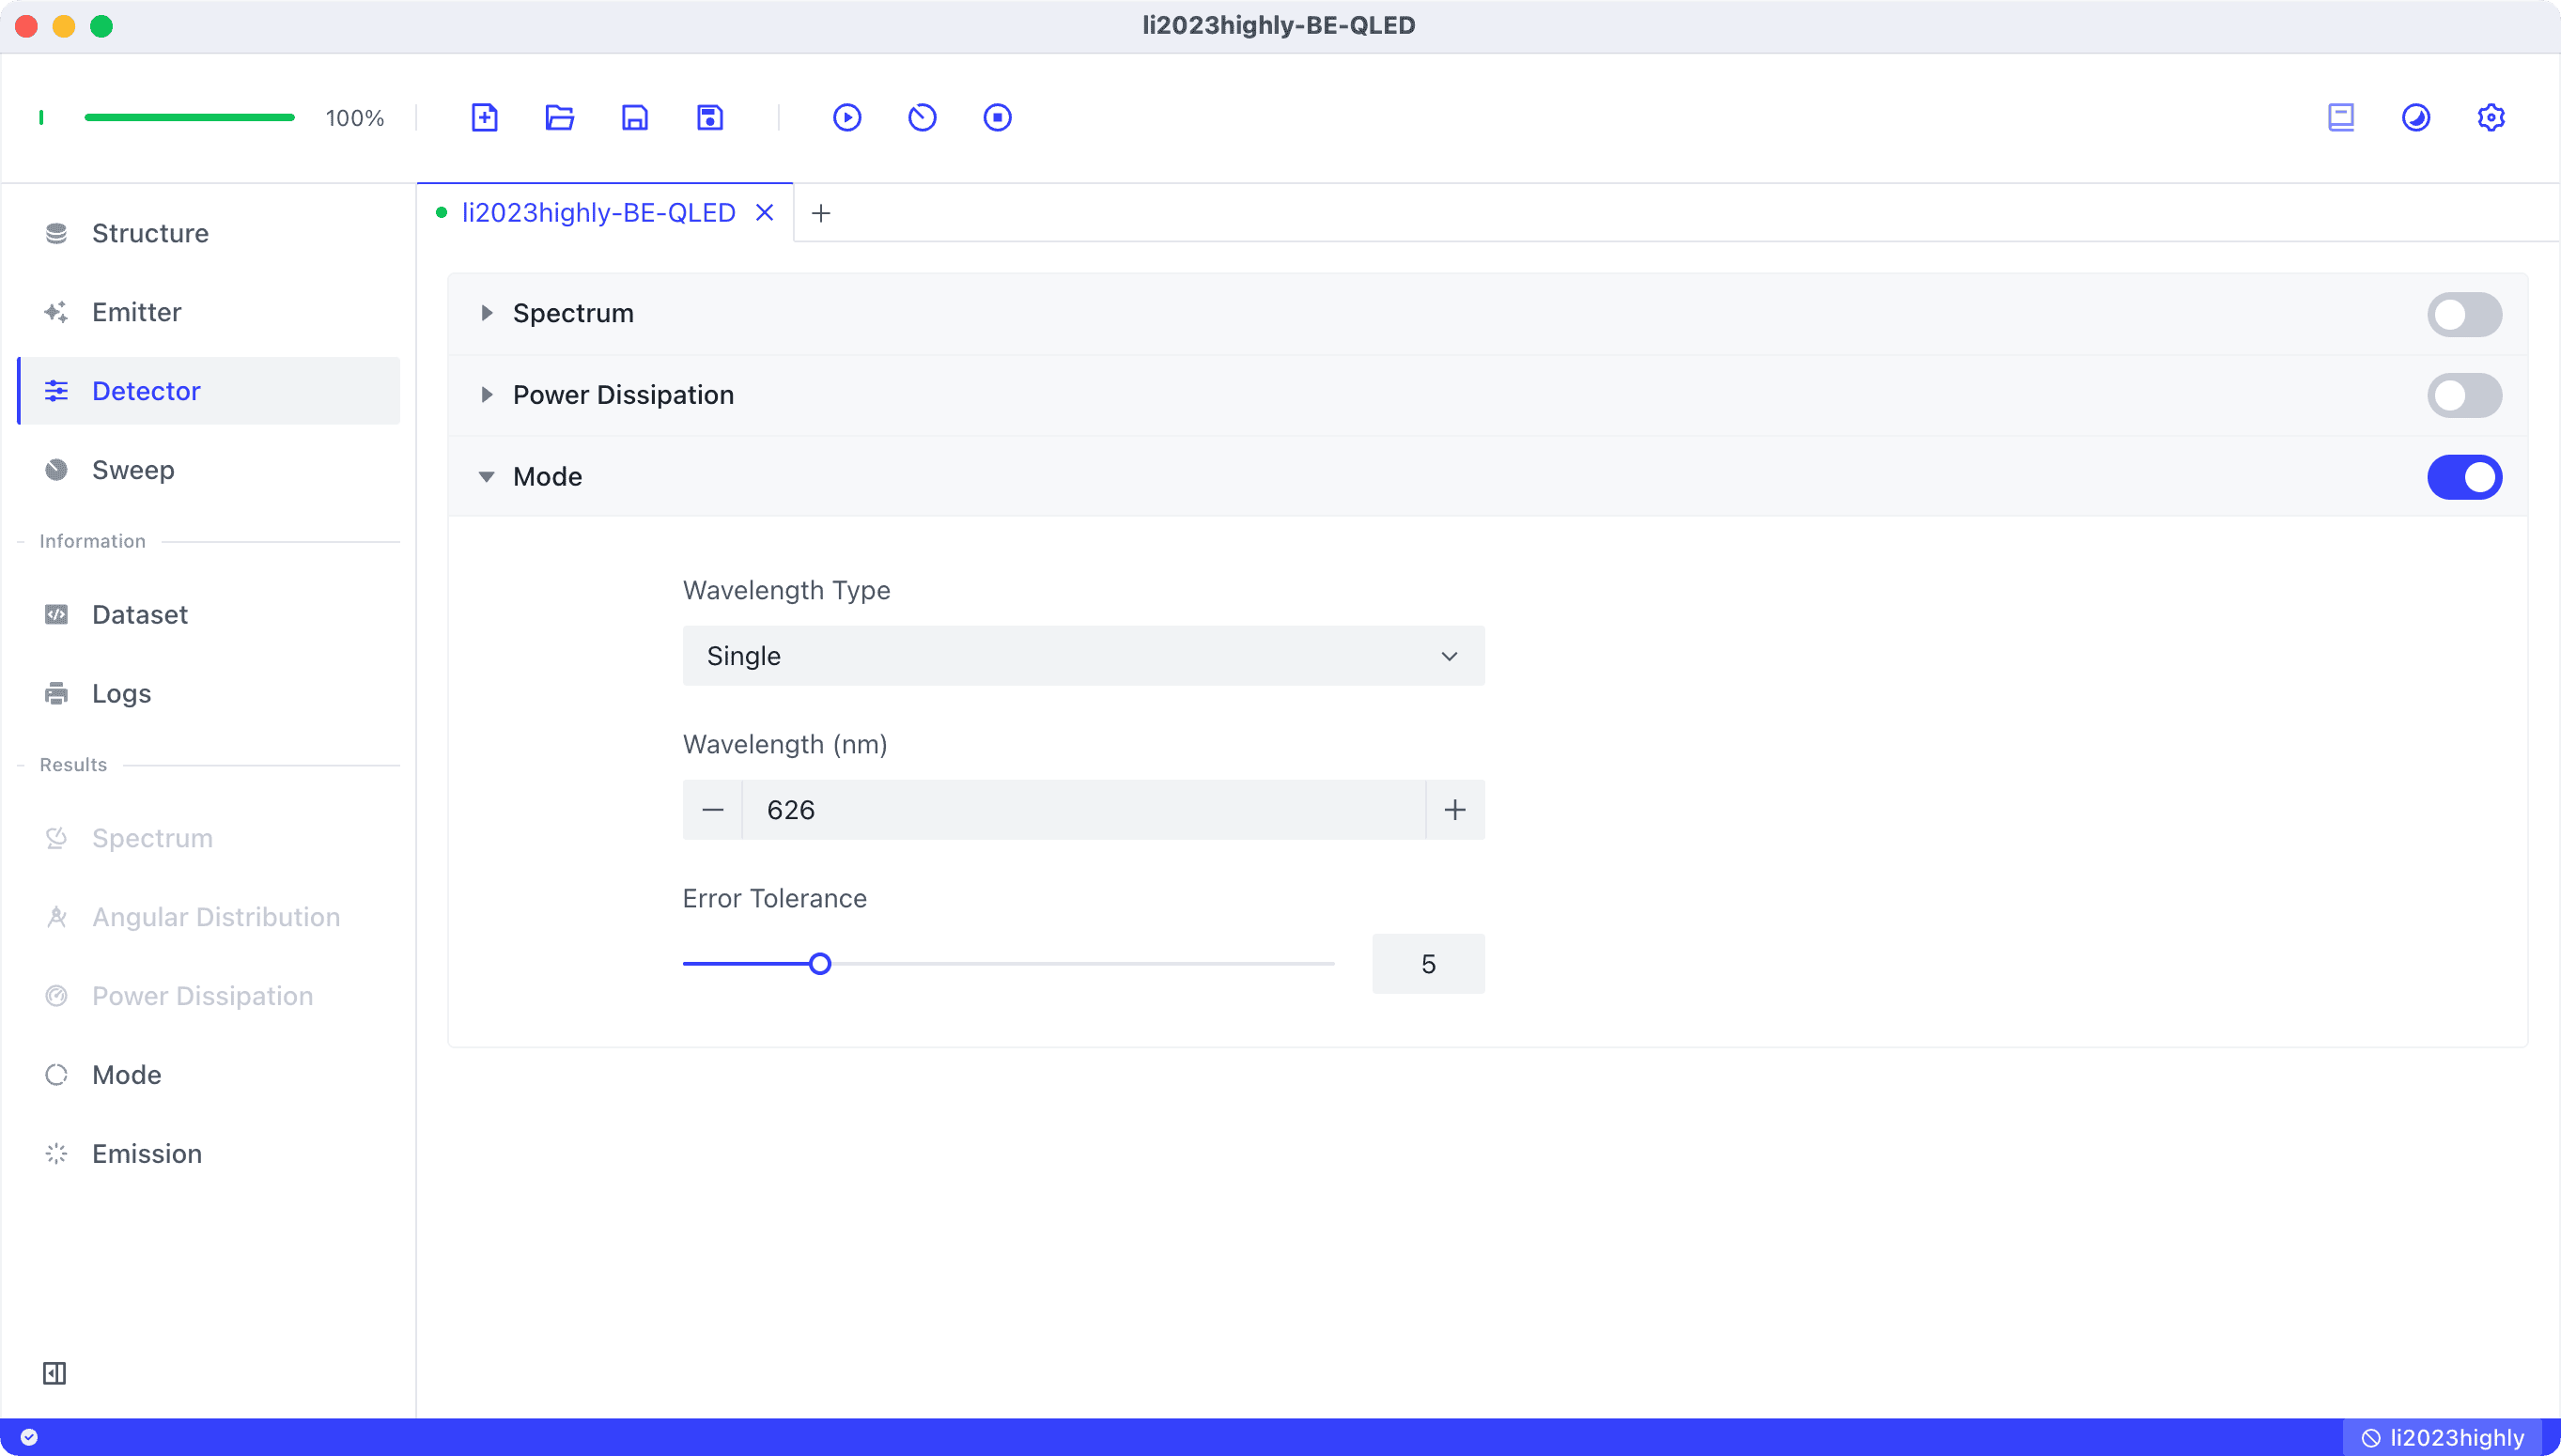
We enable the Mode Detector and set the Wavelength Type to Single. According to the caption of Figure 1, we’re only interested in the modes at 626 nm.
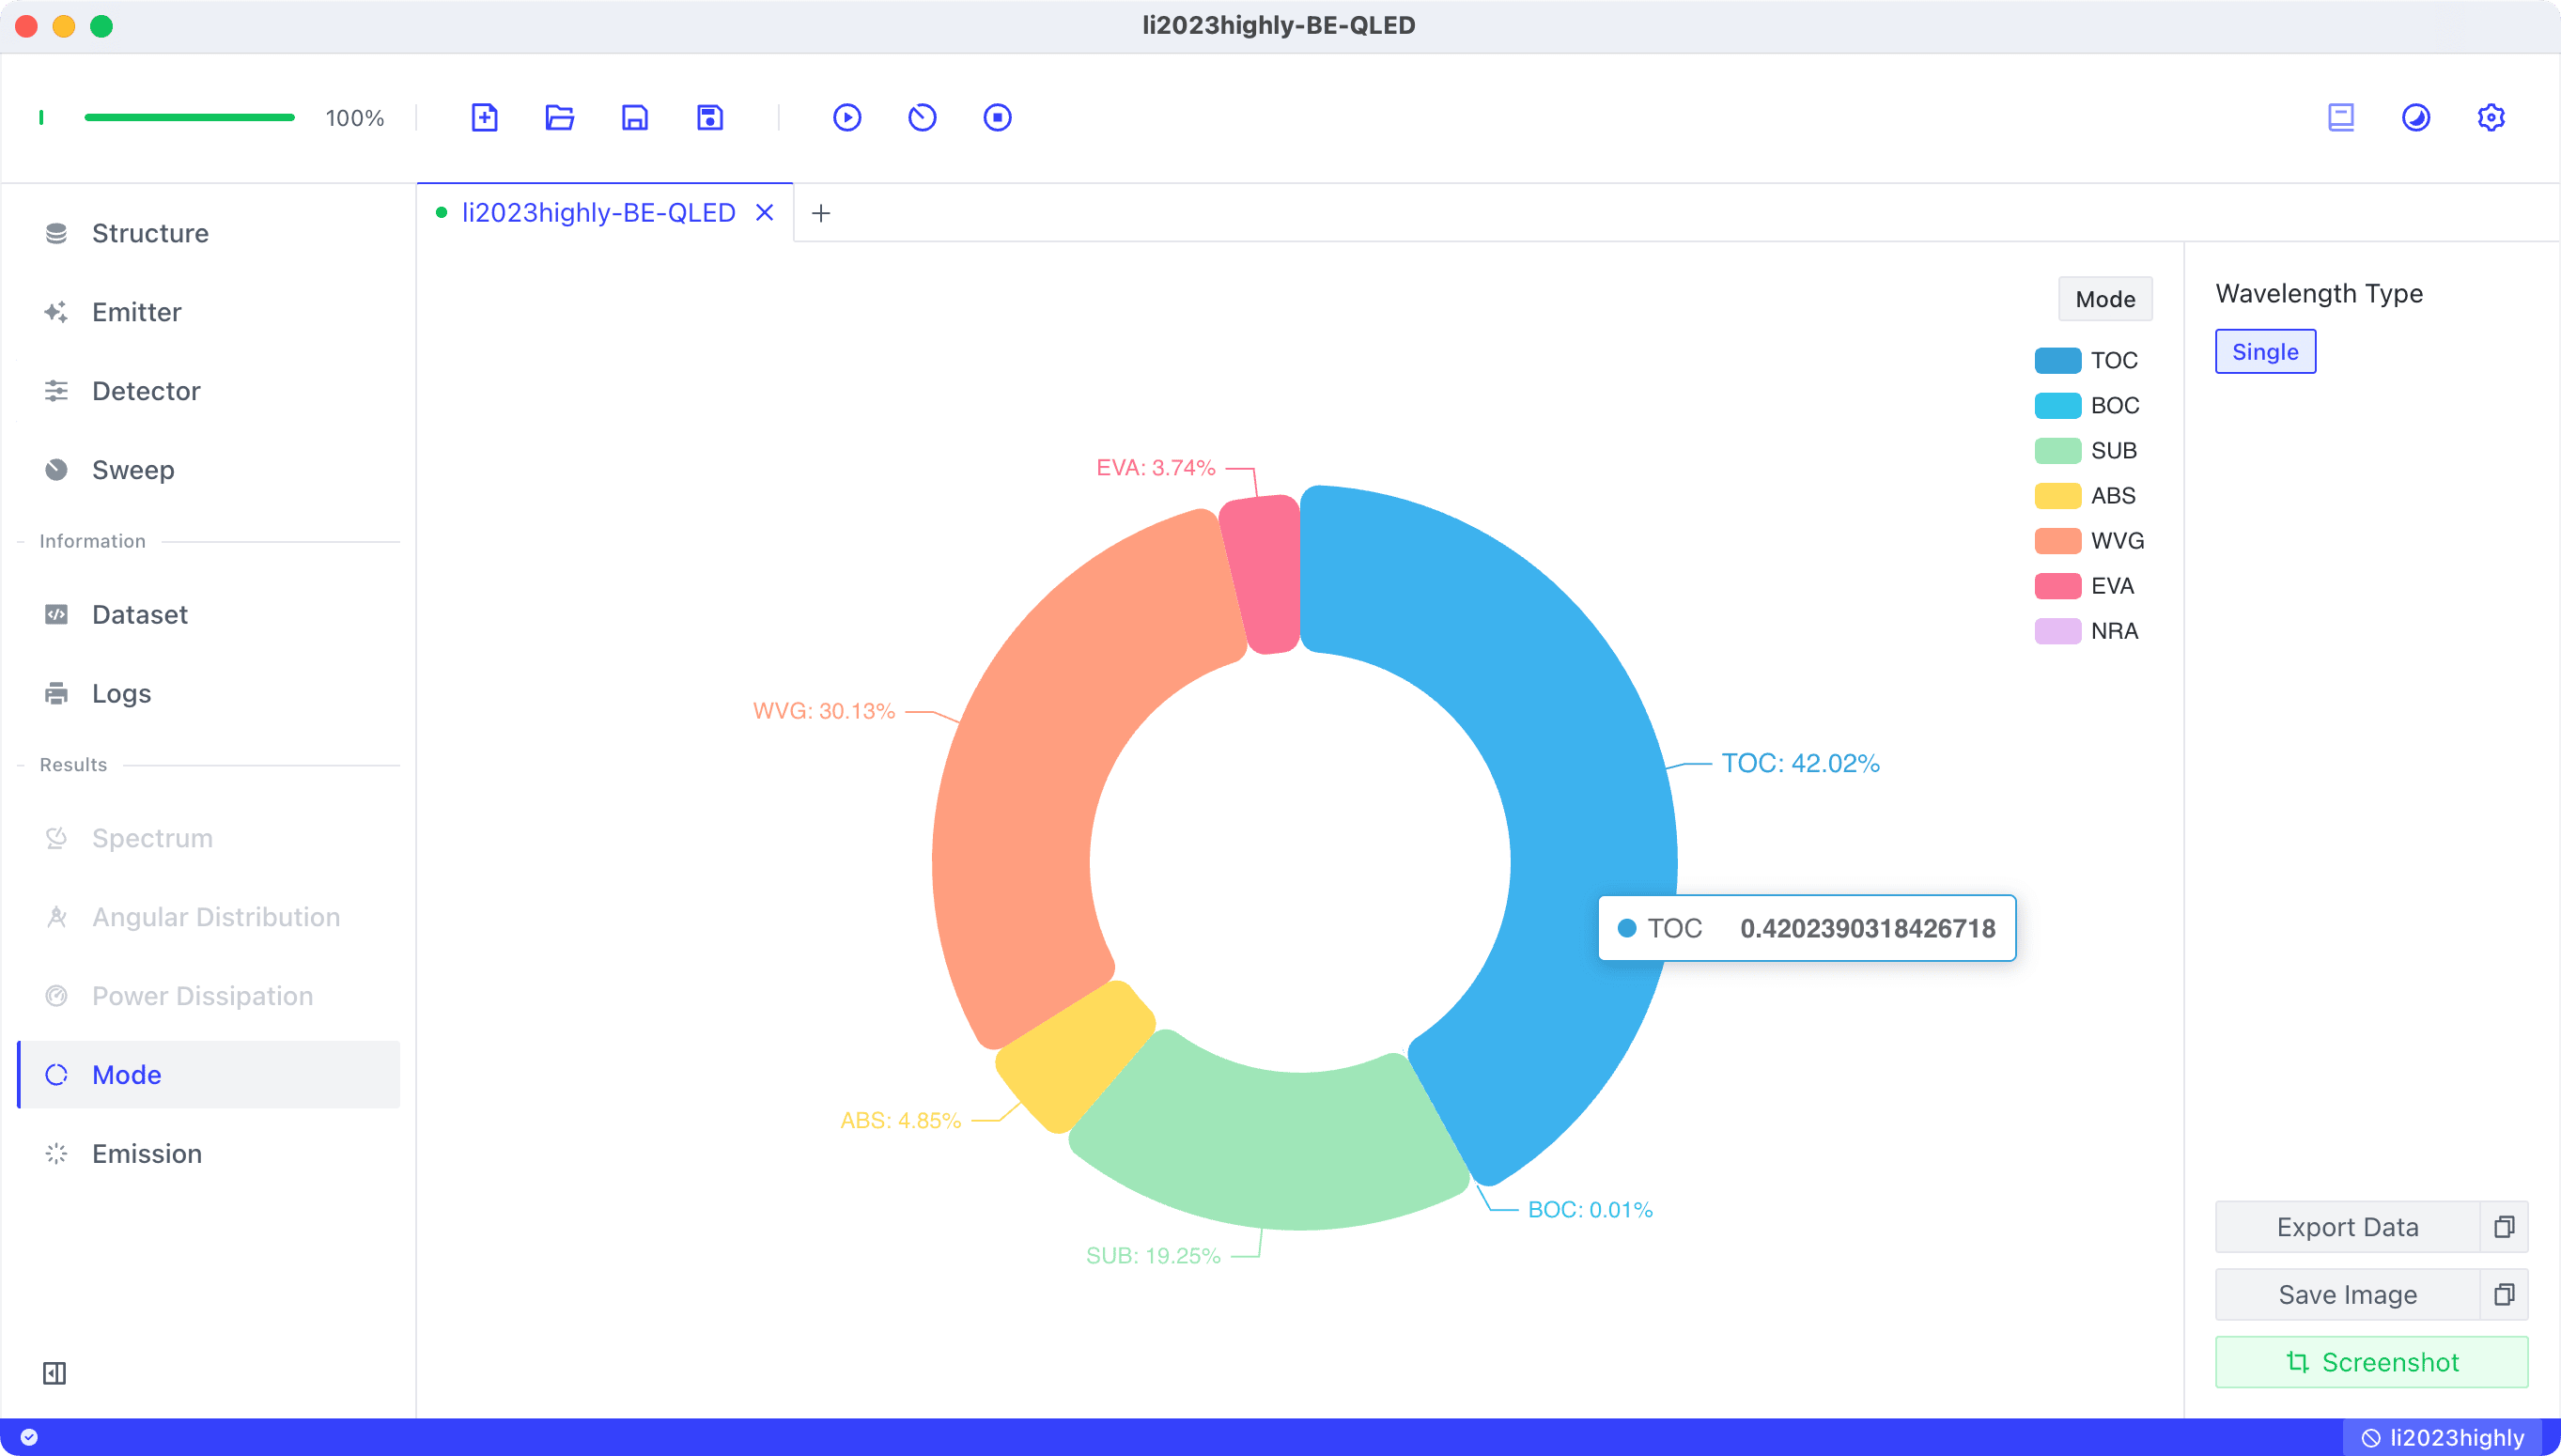
Clicking Run outputs the mode results, which closely match those in Figure 1(b). Leda calculates a TOC of 42.02%, comparable to the Air mode of 41.42% shown in Figure 1(b).
Next, we construct the TE-QLED model following Figure 1(a).
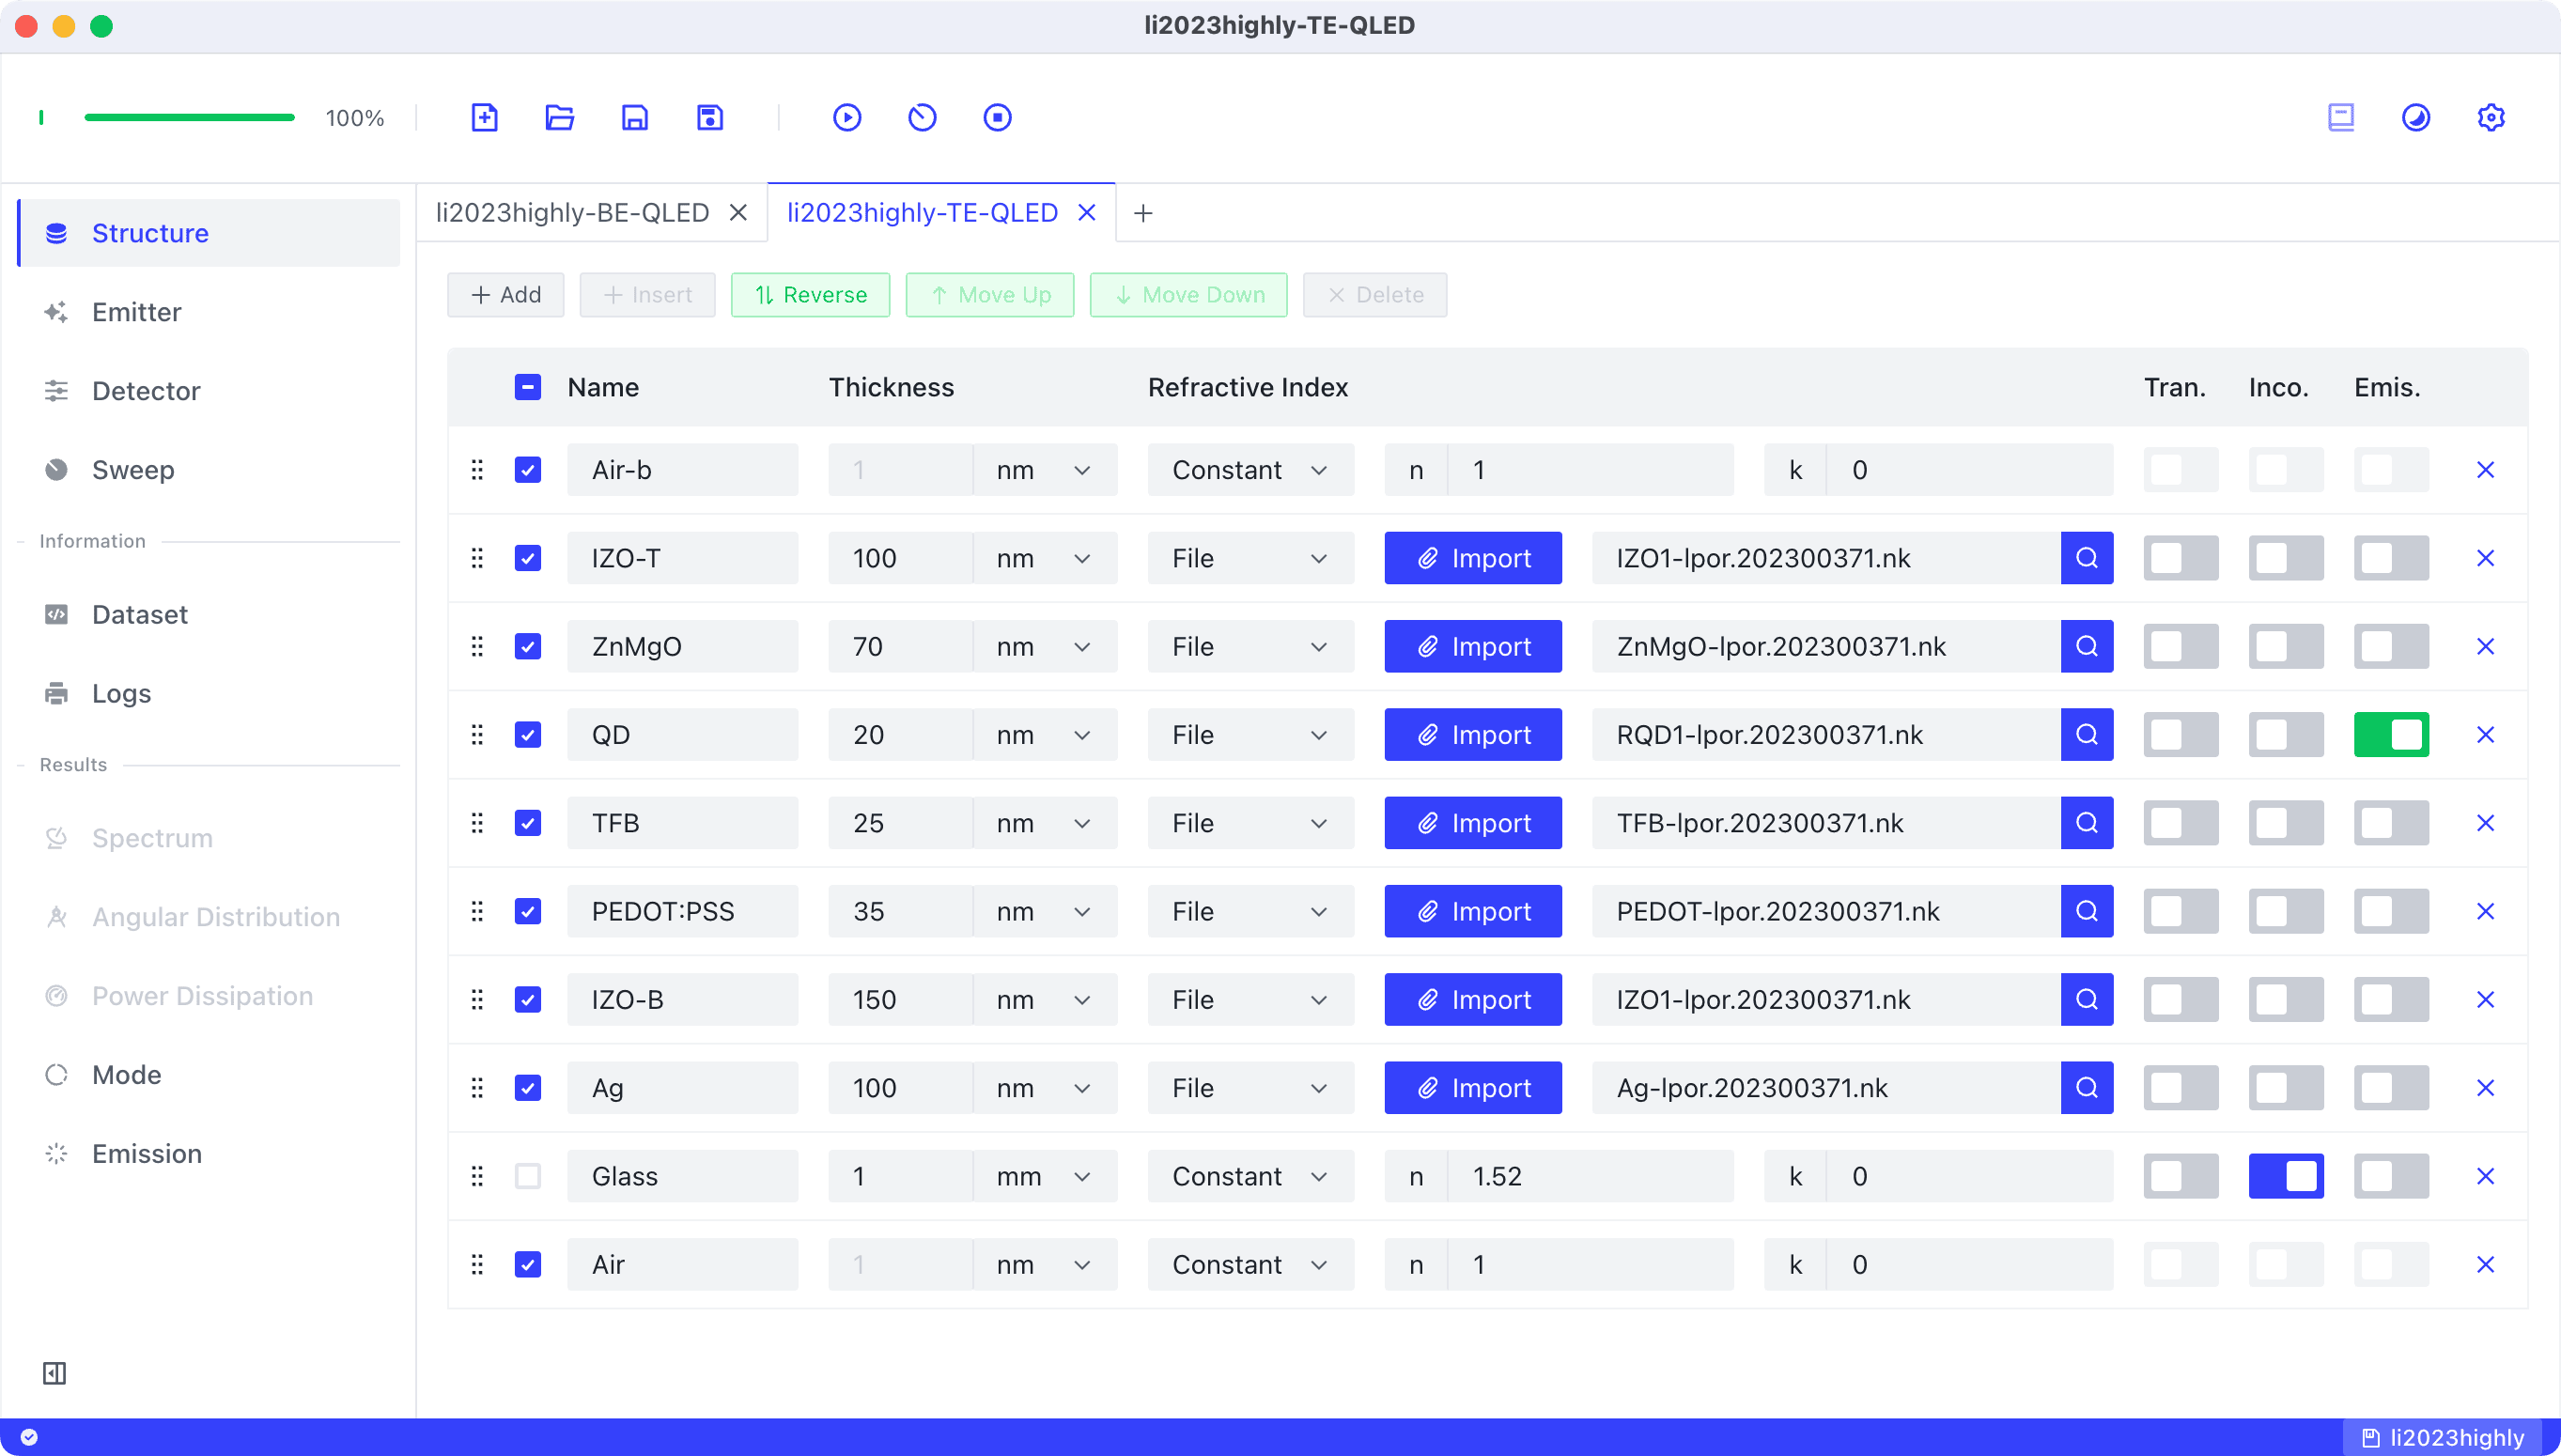
Note that we uncheck the Glass layer since the 100 nm Ag layer effectively blocks light transmission to the glass (see discussion in Layer Properties).
Using the same Emitter and Detector settings as the BE-QLED, we click Run to obtain results that closely align with Figure 1(b). Leda calculates a TOC of 45.83%, comparable to the Air mode of 45.74% shown in Figure 1(b).
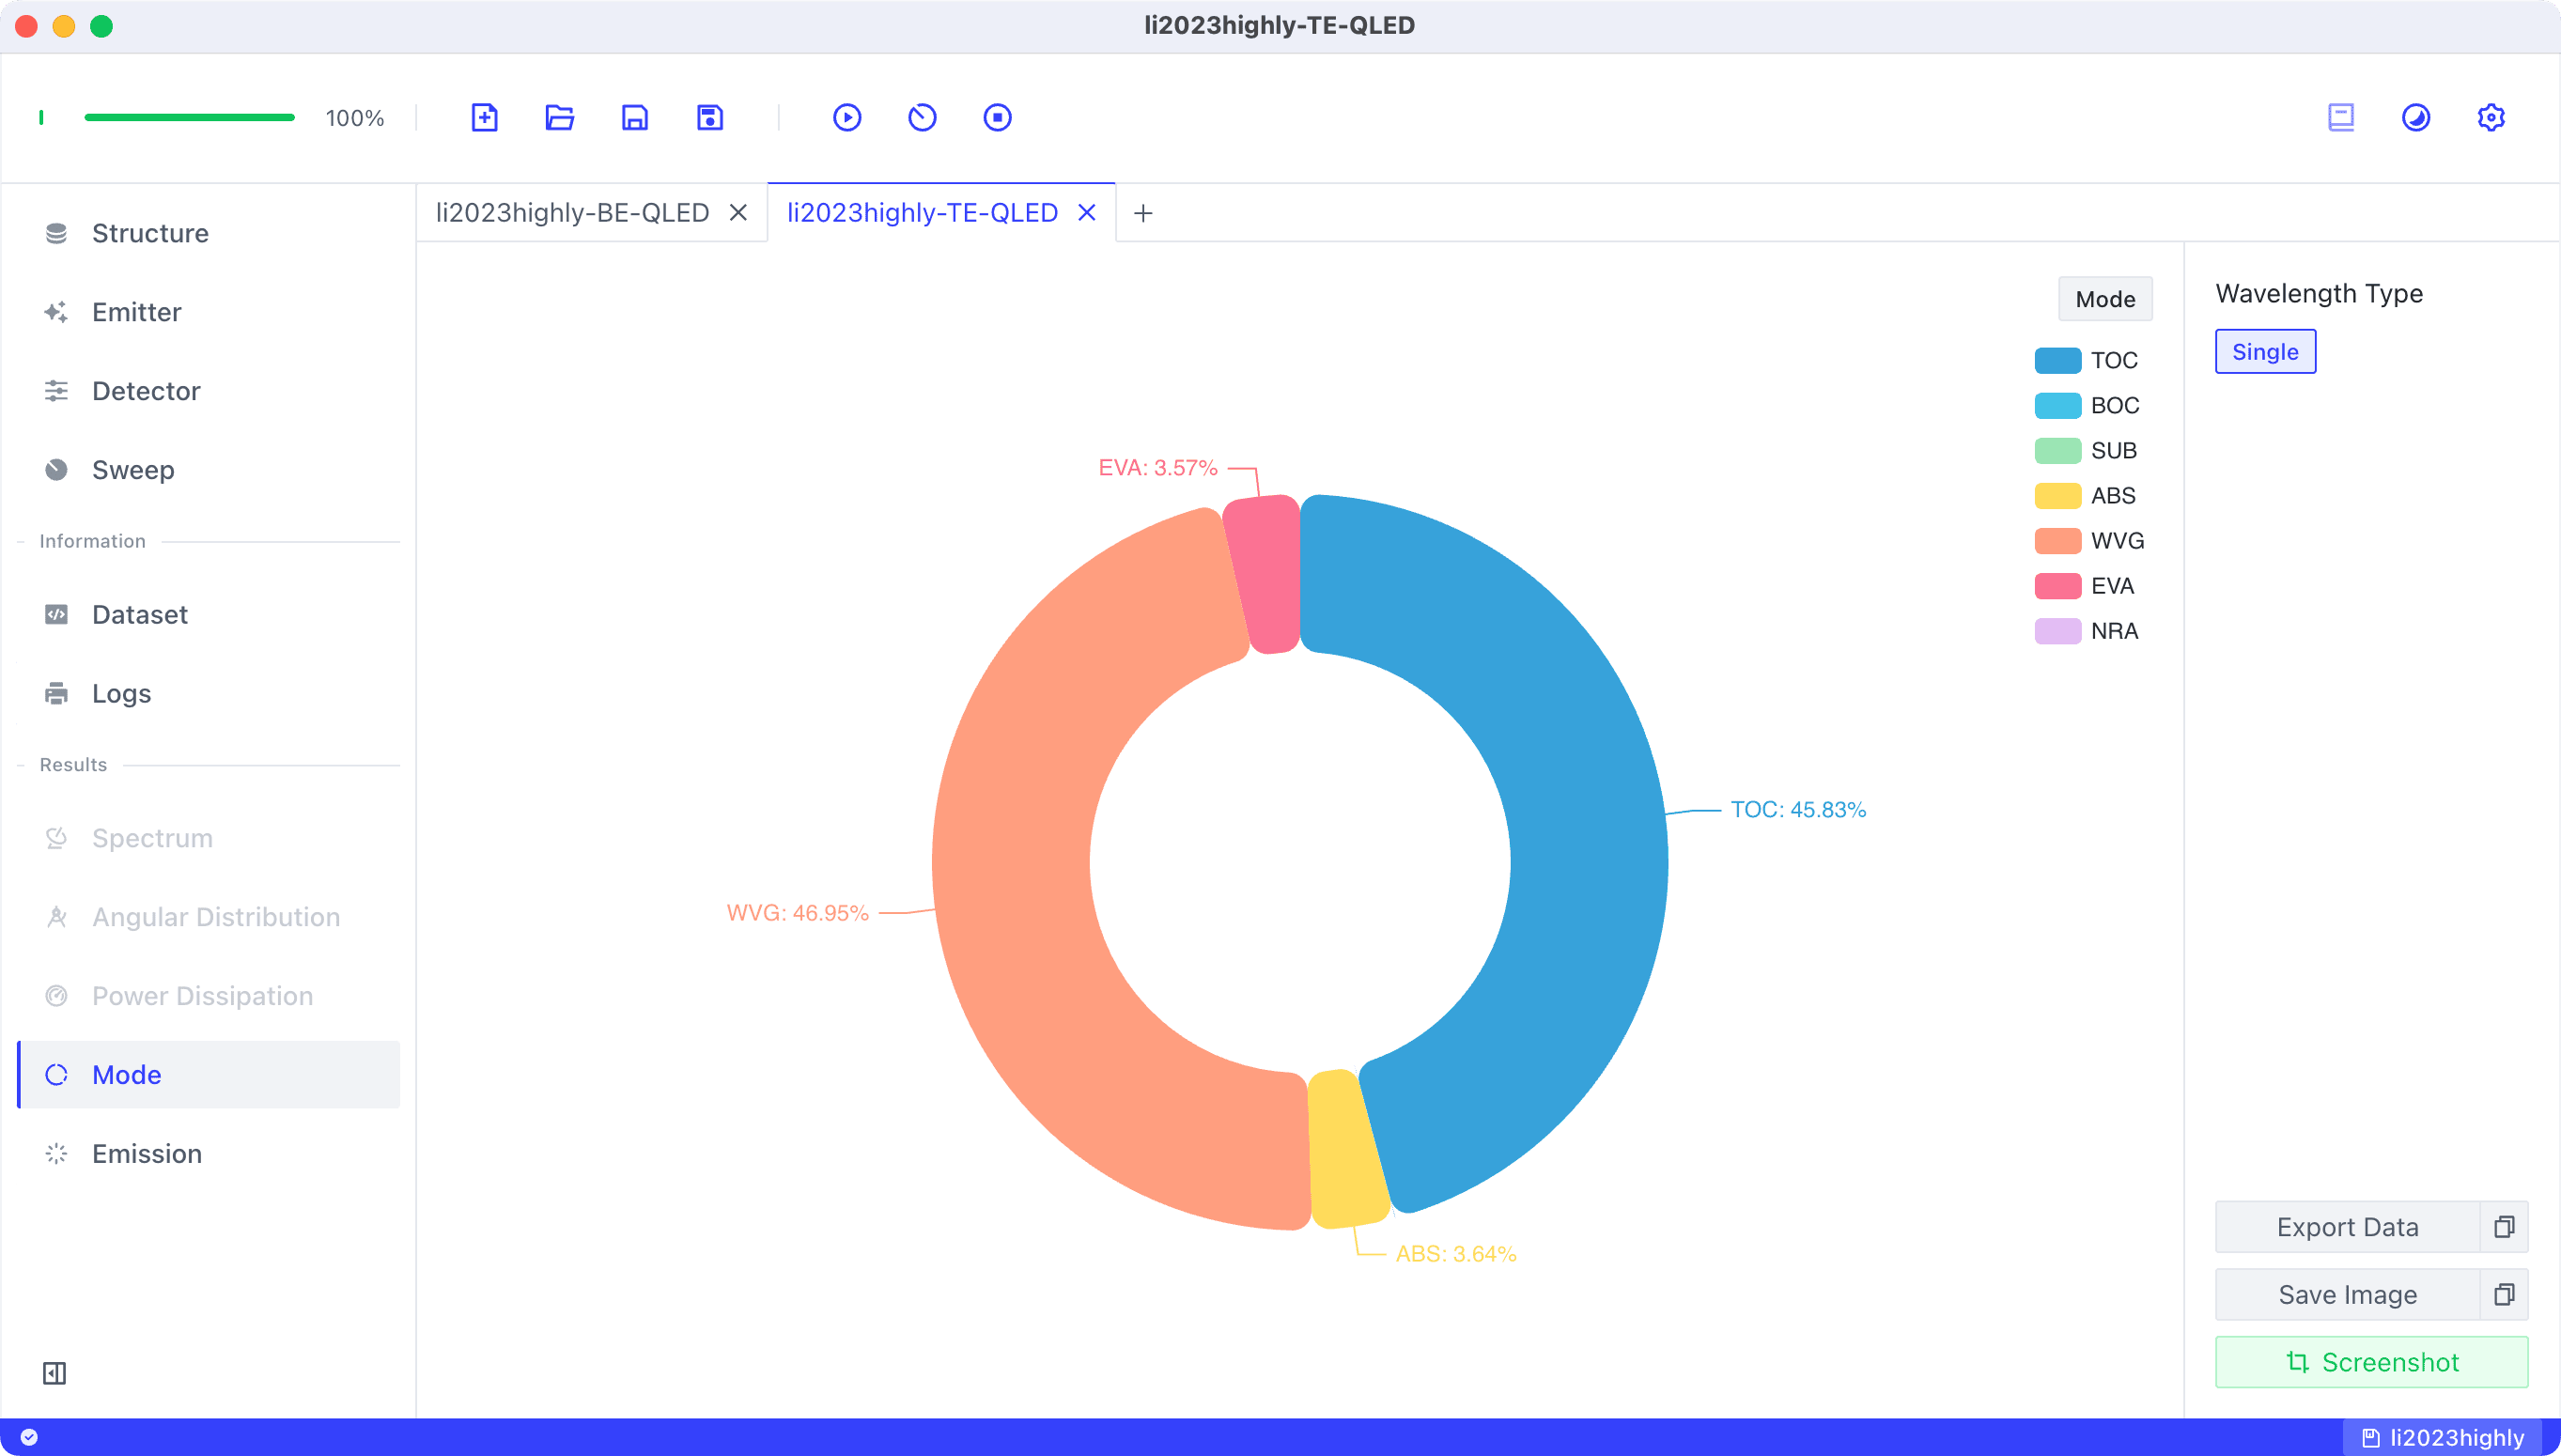
Compared to BE-QLED, we observe that the Substrate mode (SUB) disappears while both Air mode (TOC) and Waveguide mode (WVG) increase.
Power Dissipation Spectra
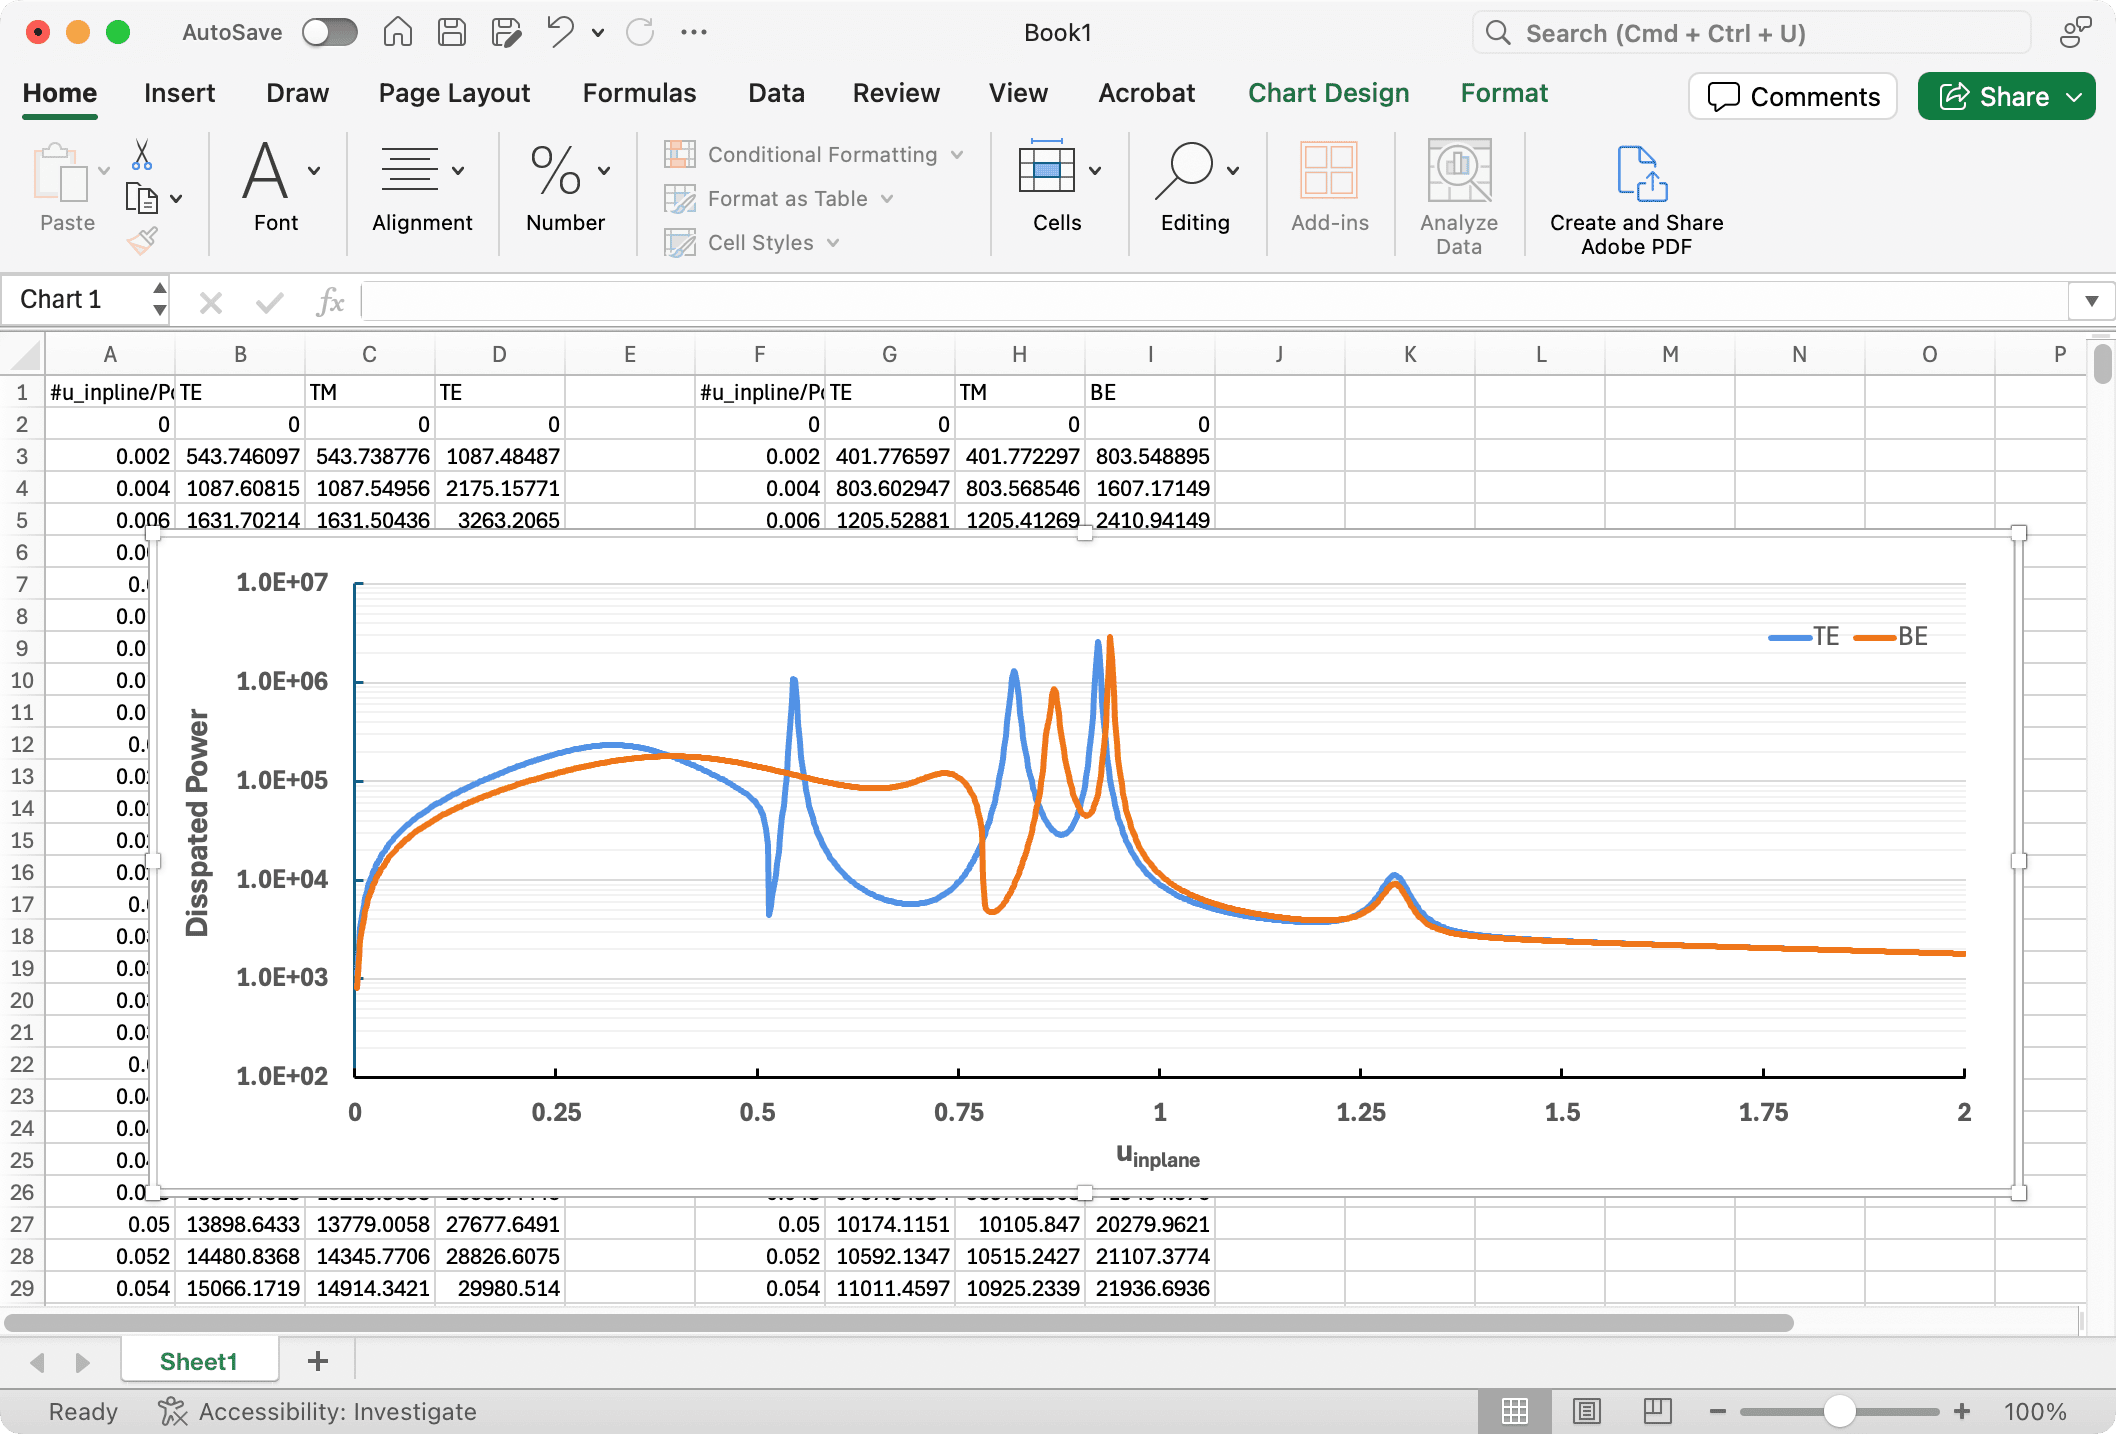
Figure 1(c) shows the power dissipation spectra of BE-QLED and TE-QLED at 626 nm.
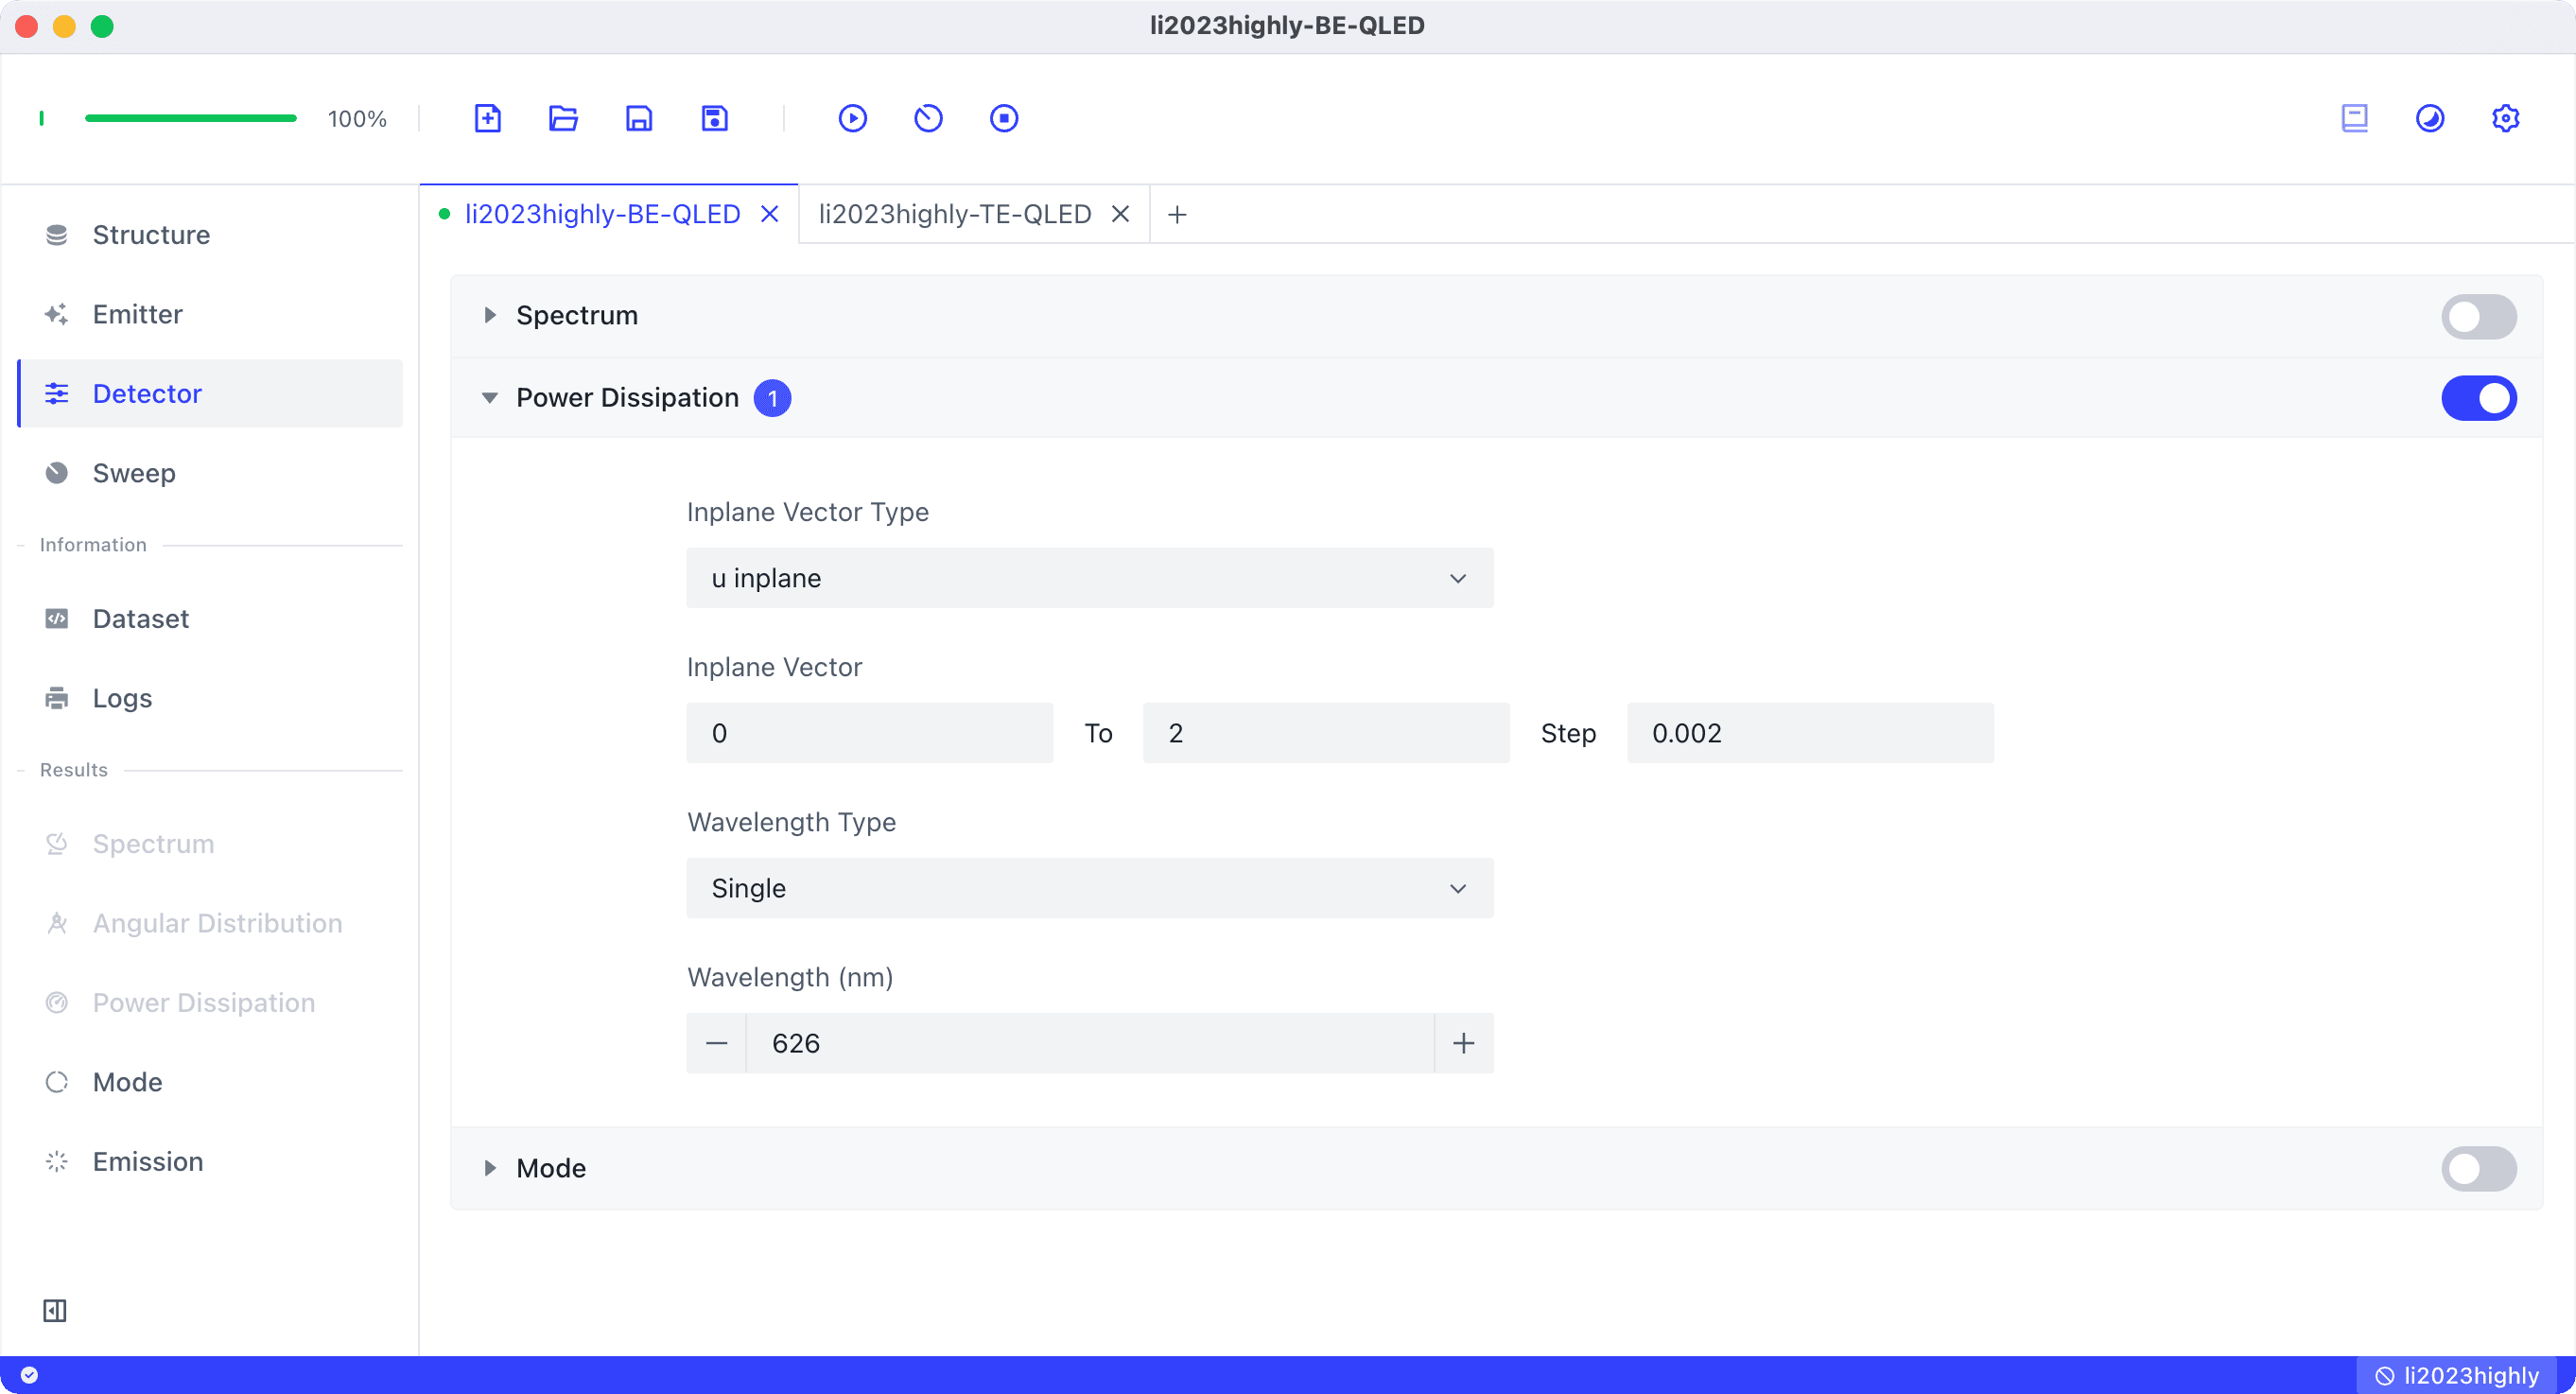
We enable the Power Dissipation detector for both BE-QLED and TE-QLED configurations, setting the u inplane range to 0–2 with a Step of 0.002, as shown below.
After simulation, we can quickly export the data to Excel using Leda’s one-click data copy feature.
After formatting, we obtain the power dissipation spectra for BE-QLED and TE-QLED as shown below.
Microcavity Optimization
Figure 1(d) demonstrates the optimization of efficiency through microcavity effects. With a QY of 90.59%, the optimal EQE/γ of 41.4% was achieved with bottom IZO thickness of 150 nm and top IZO thickness of 100 nm.
We duplicate the TE-QLED simulation file and make the following modifications:
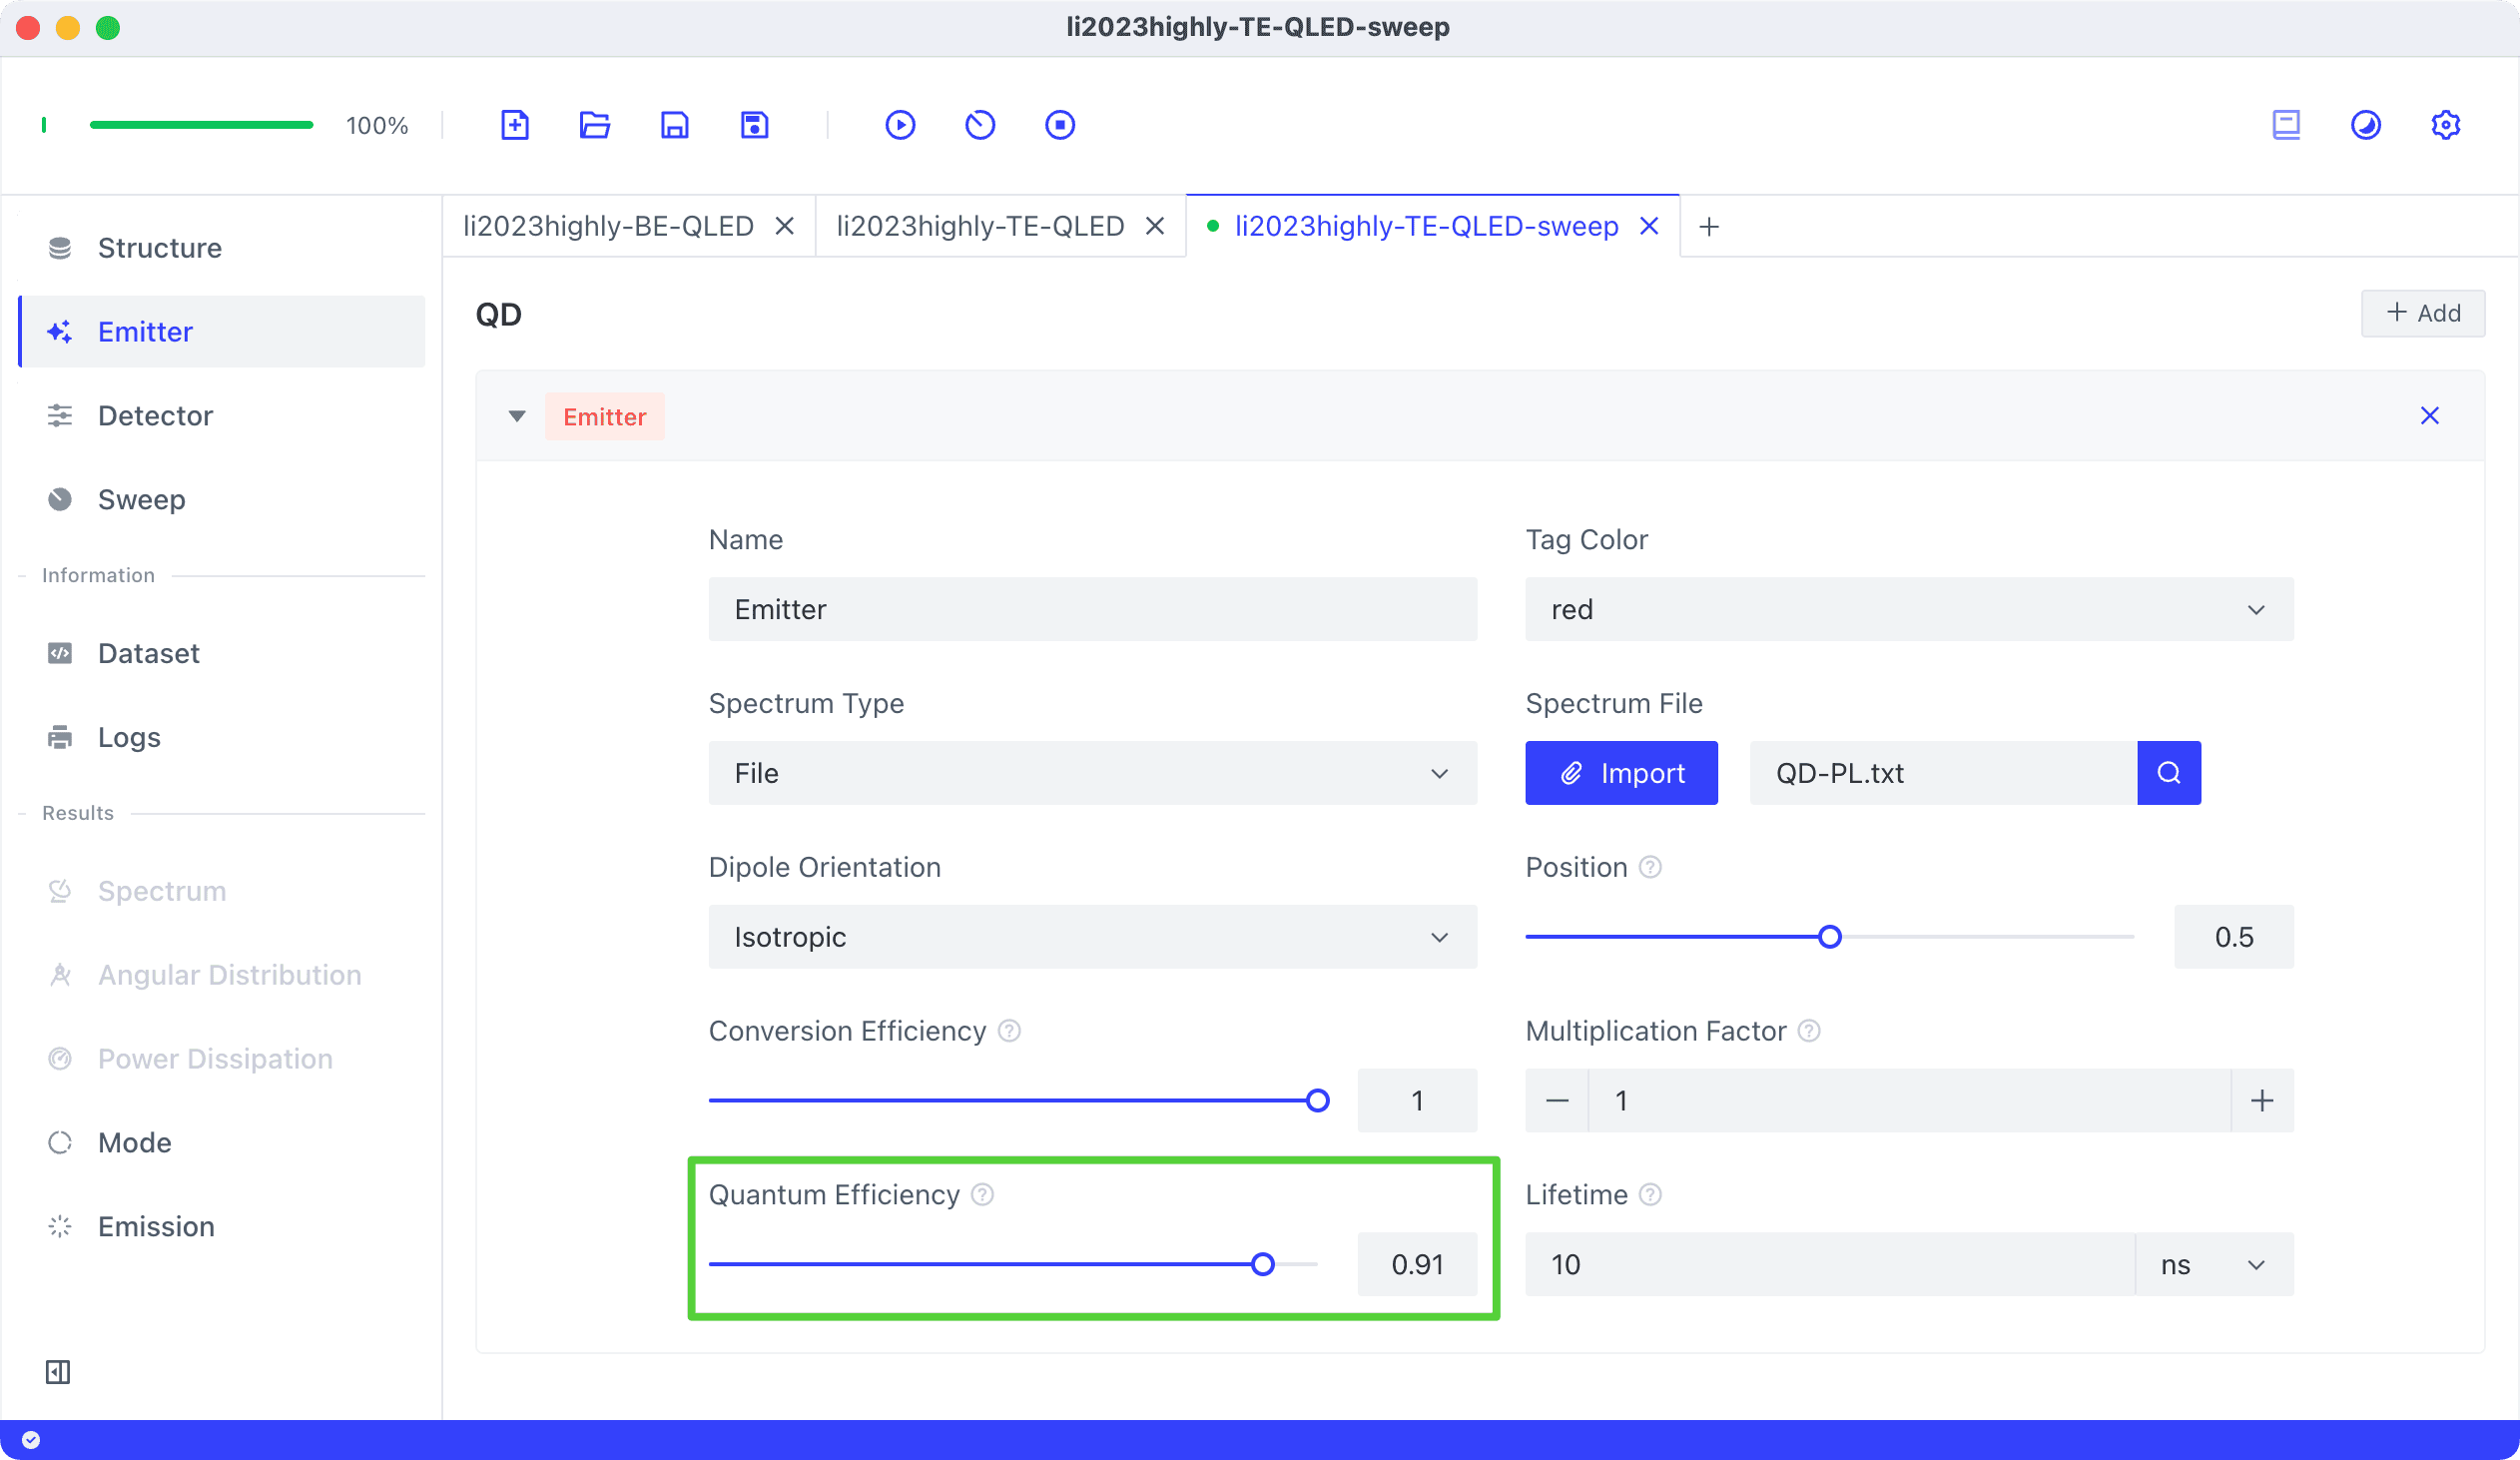
- Set the Emitter’s
Quantum Efficiencyto 91%.
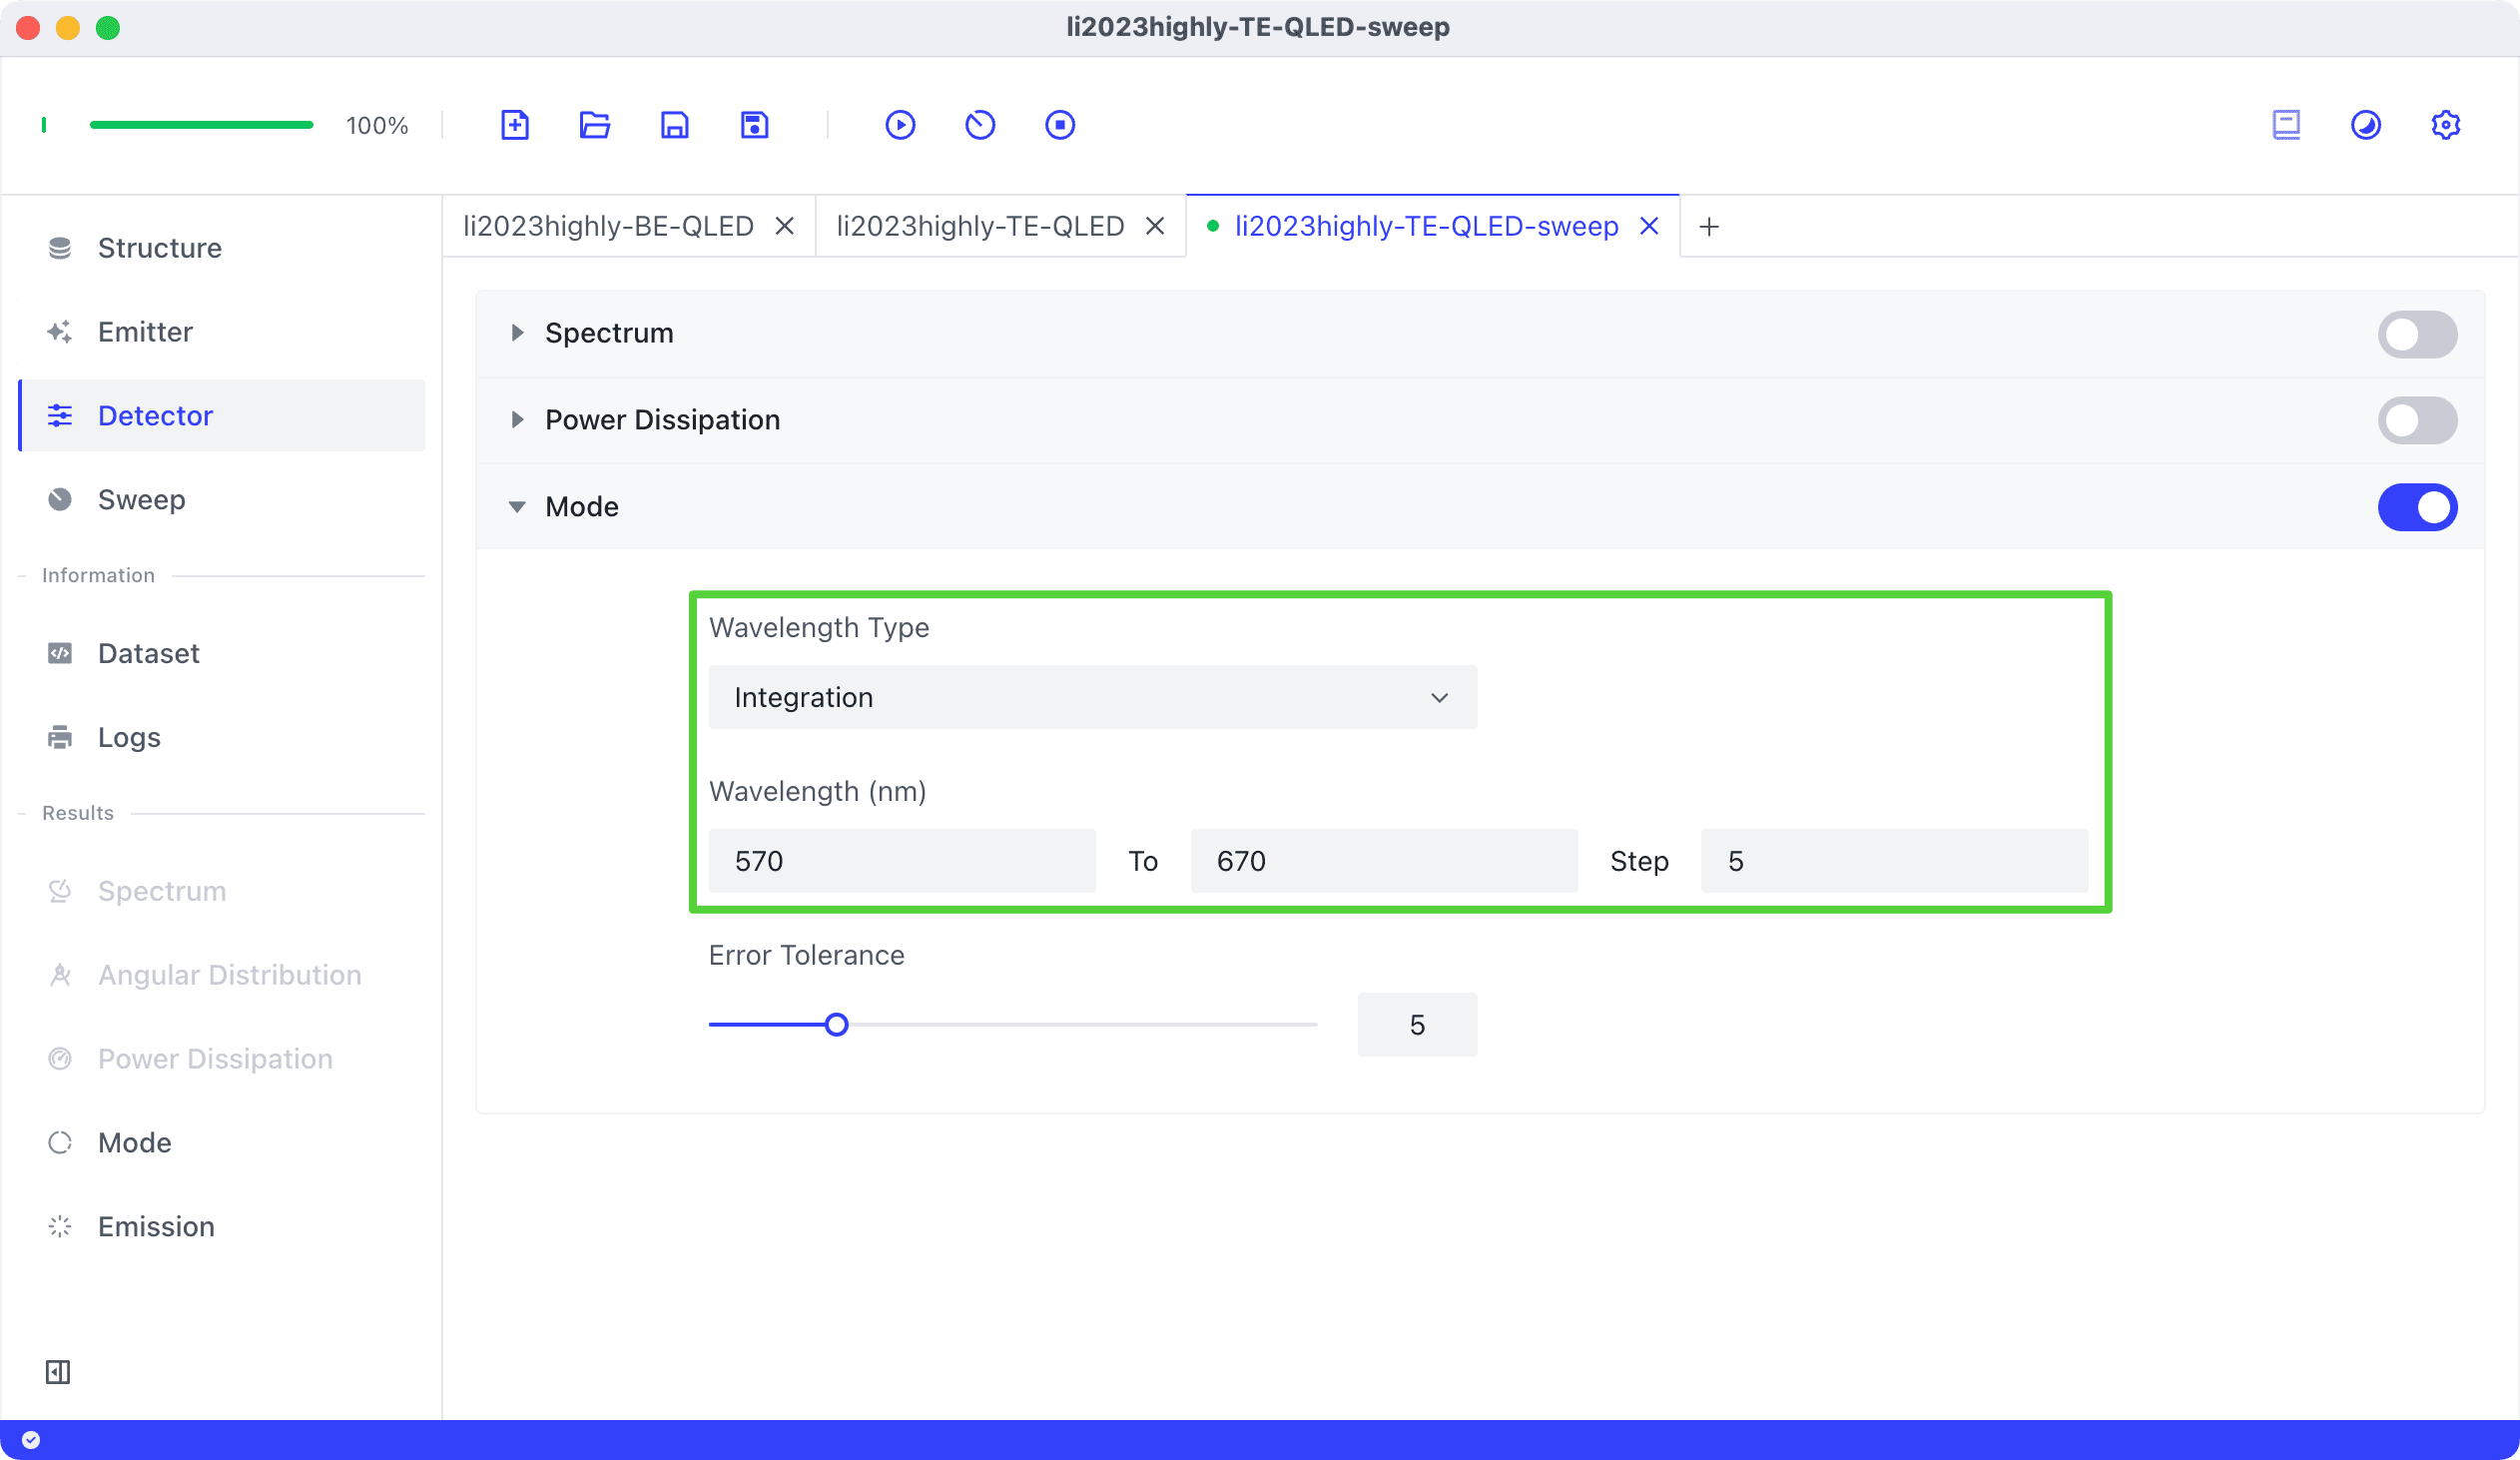
- Enable only the Mode detector and set
Wavelength TypetoIntegration. Based on the Emitter’s spectral range, set the Wavelength range from 570 to 670 nm with a Step of 5 nm.
- In Sweep, add thickness sweeps for IZO-B and IZO-T from 5 nm to 200 nm with a step of 5 nm (you can increase precision at the cost of computation time).
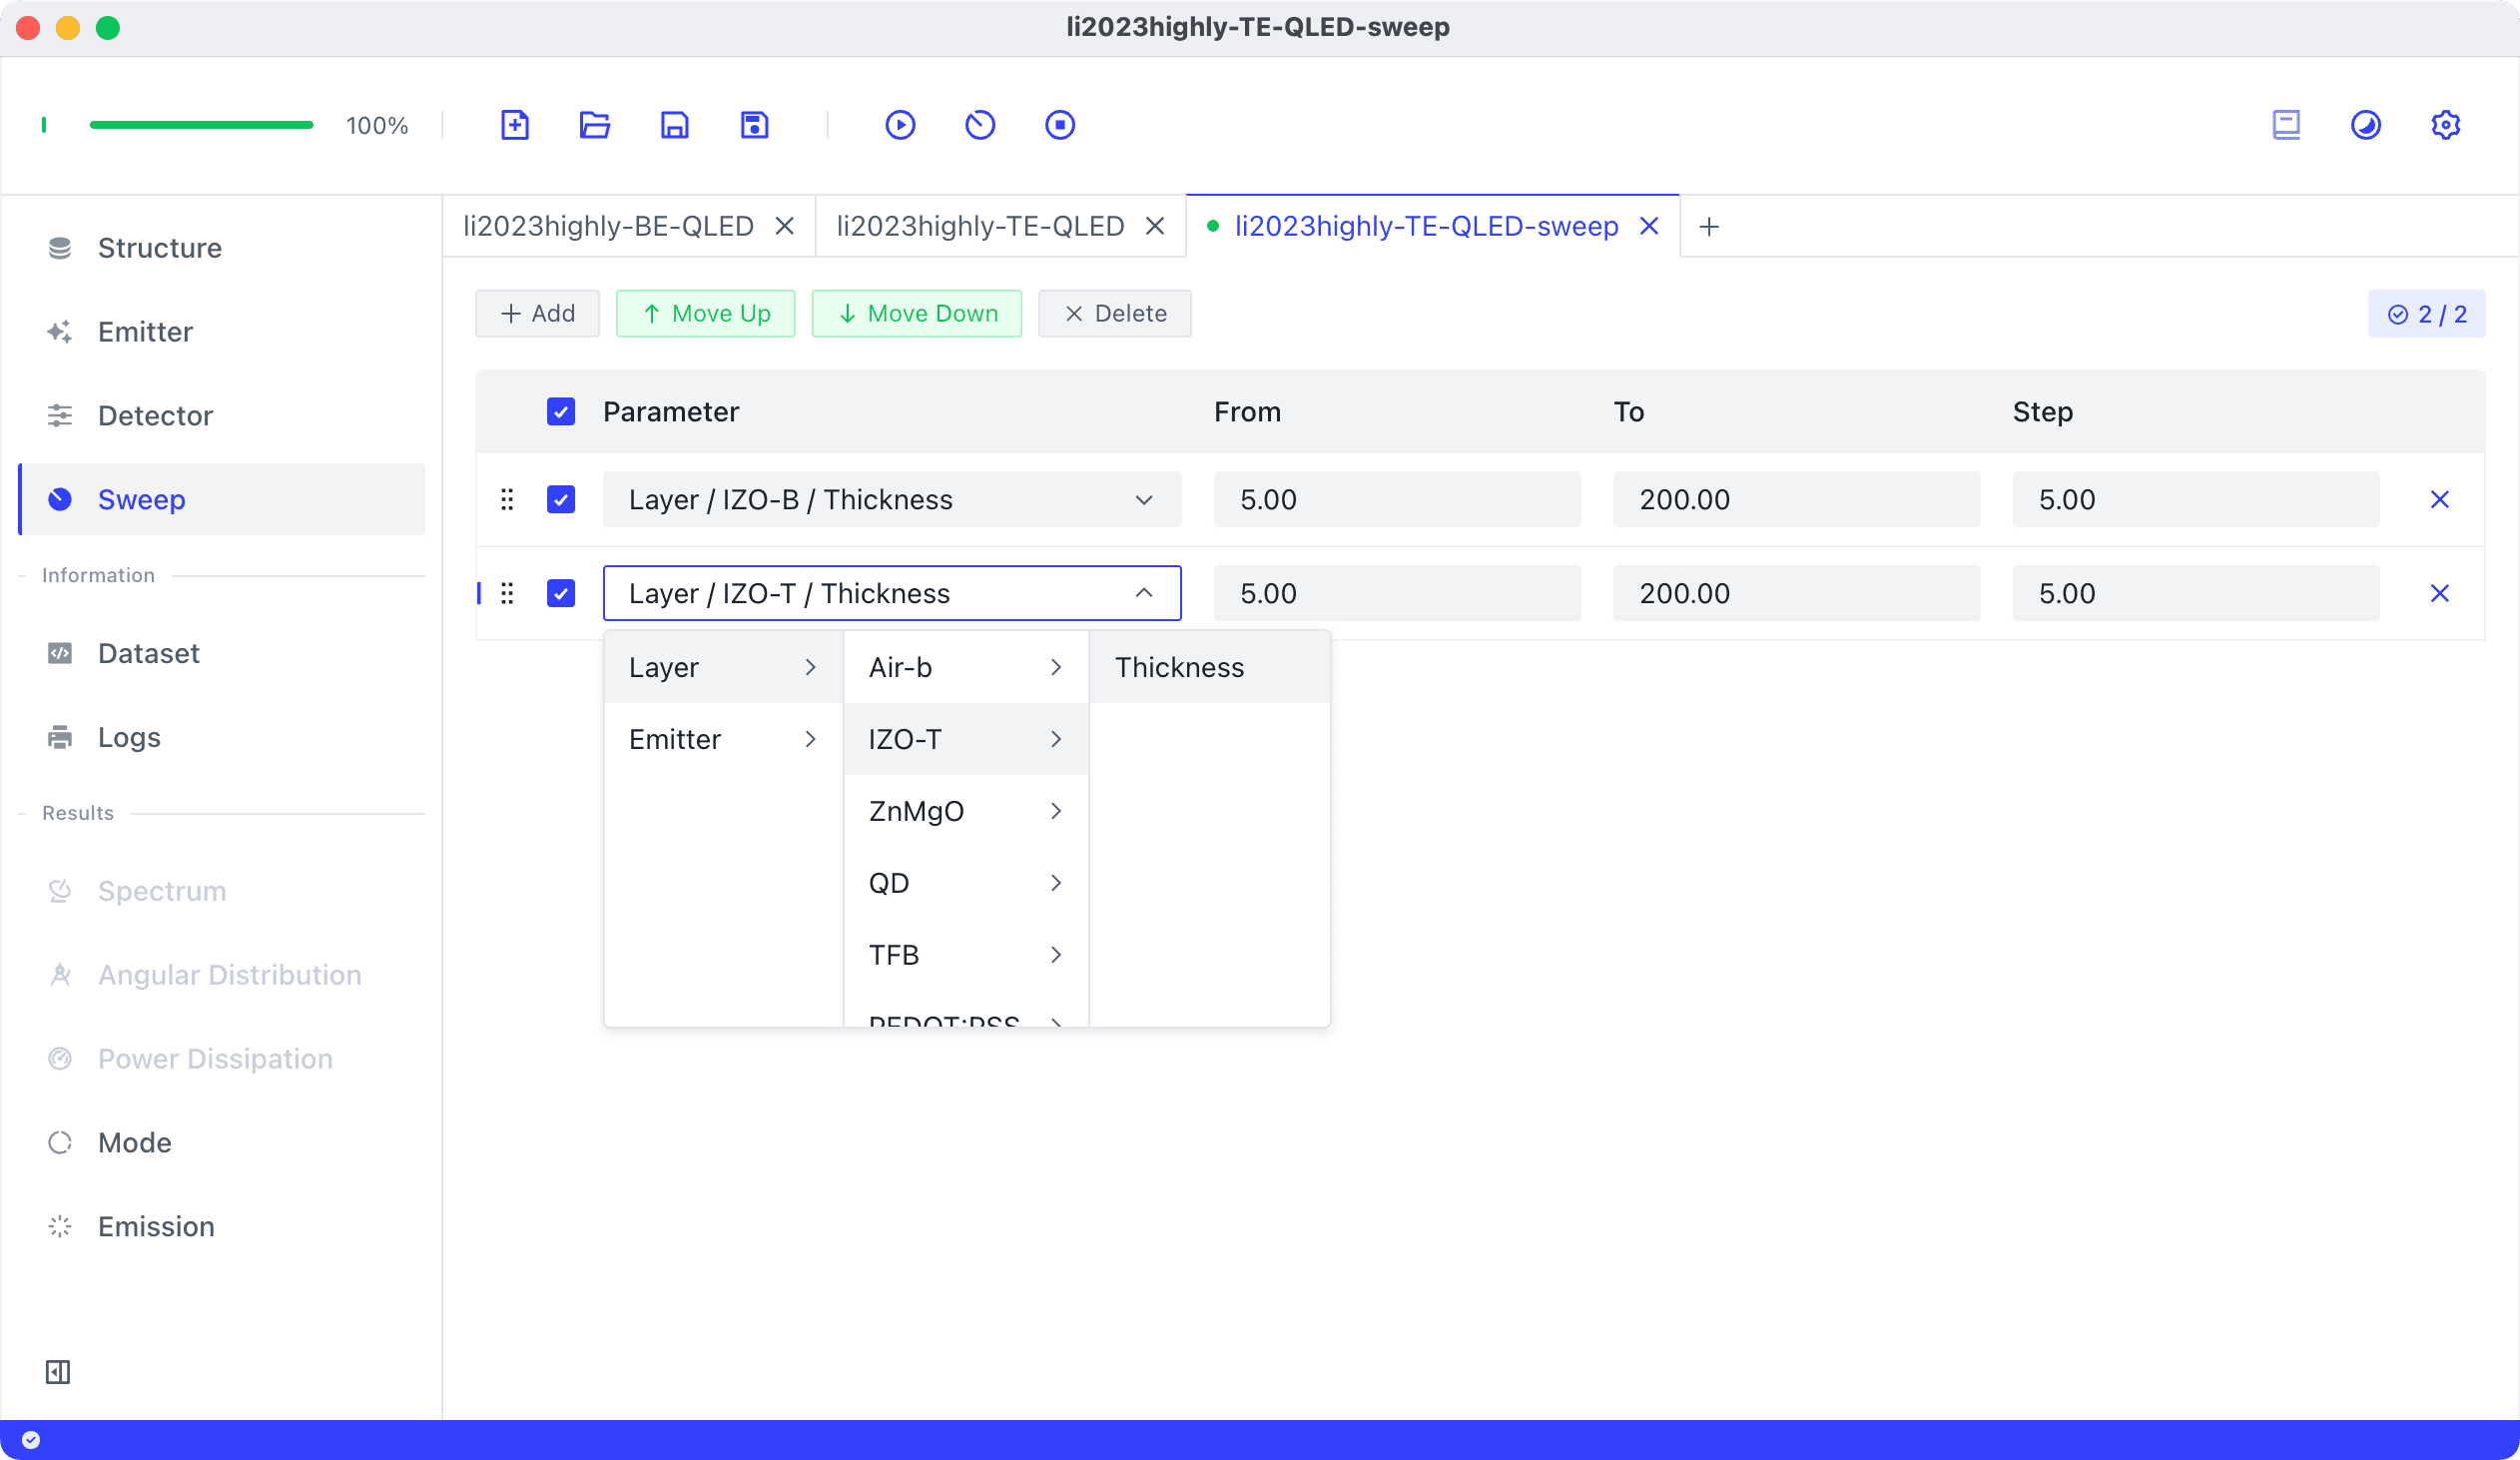
Click Run Sweep to obtain the results. Switch the Chart Type to Heatmap to observe how EQE varies with bottom and top IZO thicknesses. As shown below, we reproduce the pattern seen in Figure 1(d).
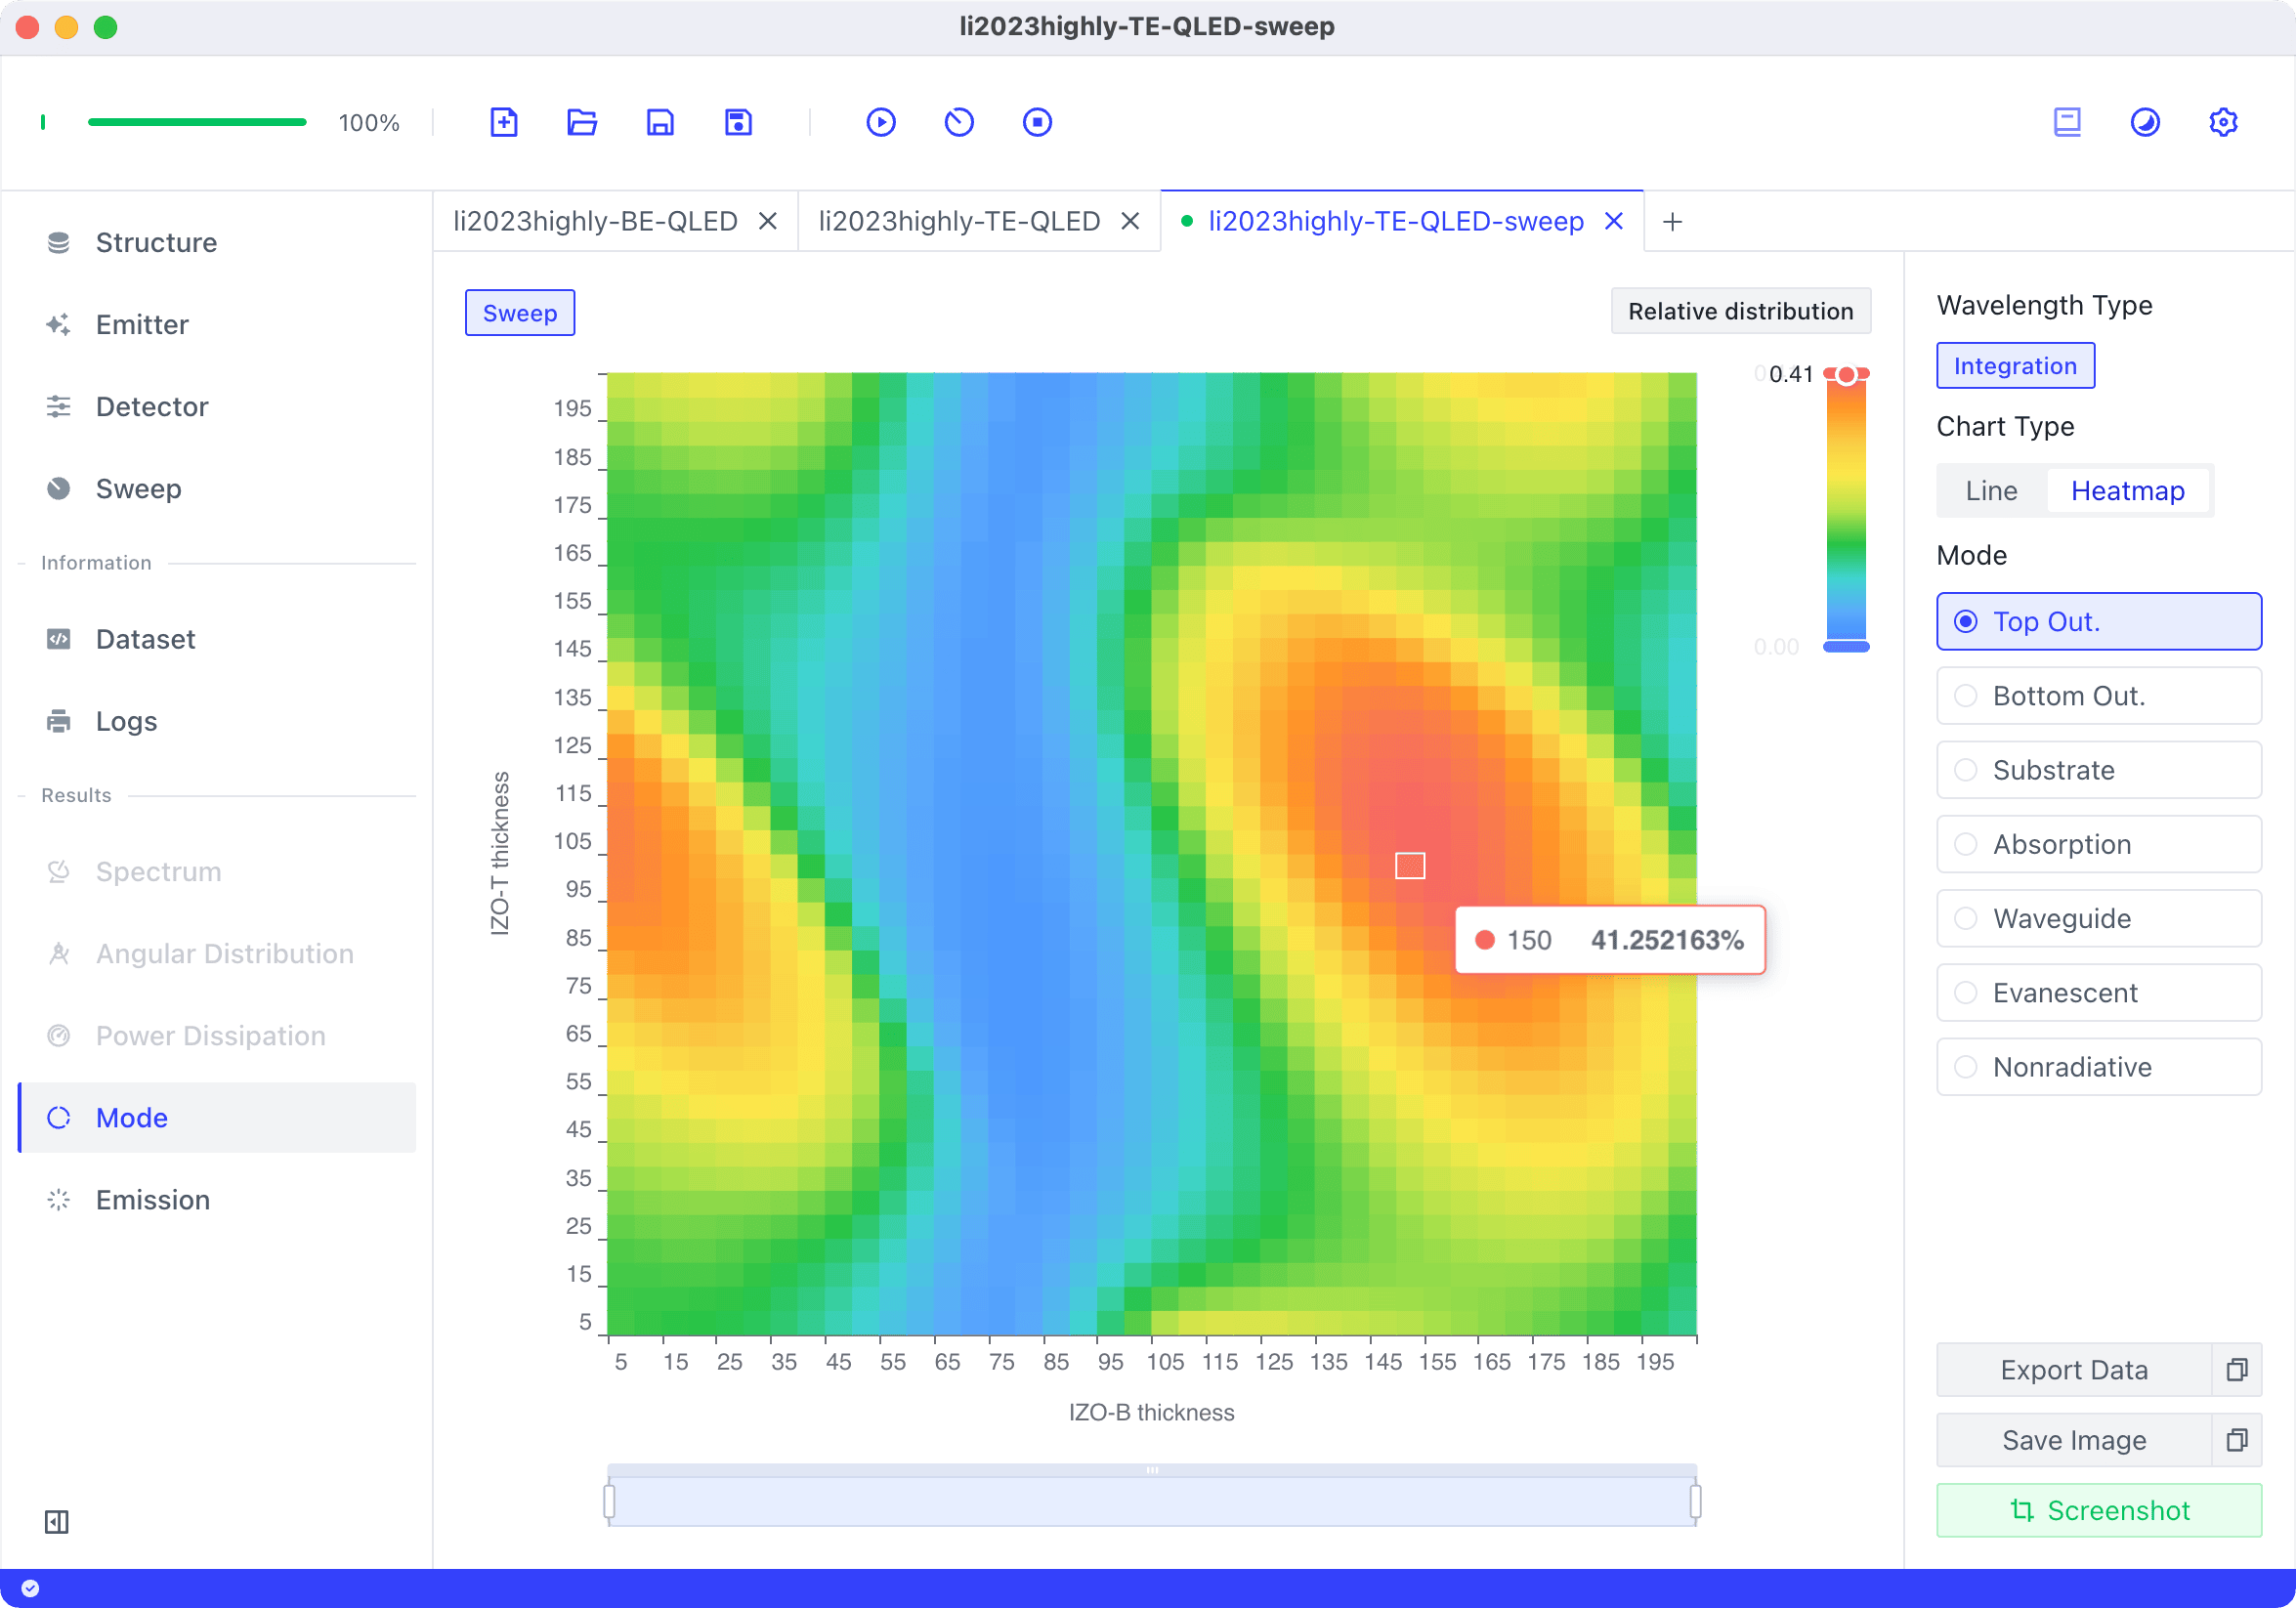
The optimal efficiency occurs at IZO-B thickness of 150 nm and IZO-T thickness of 100 nm, matching the parameters used in our initial analysis.
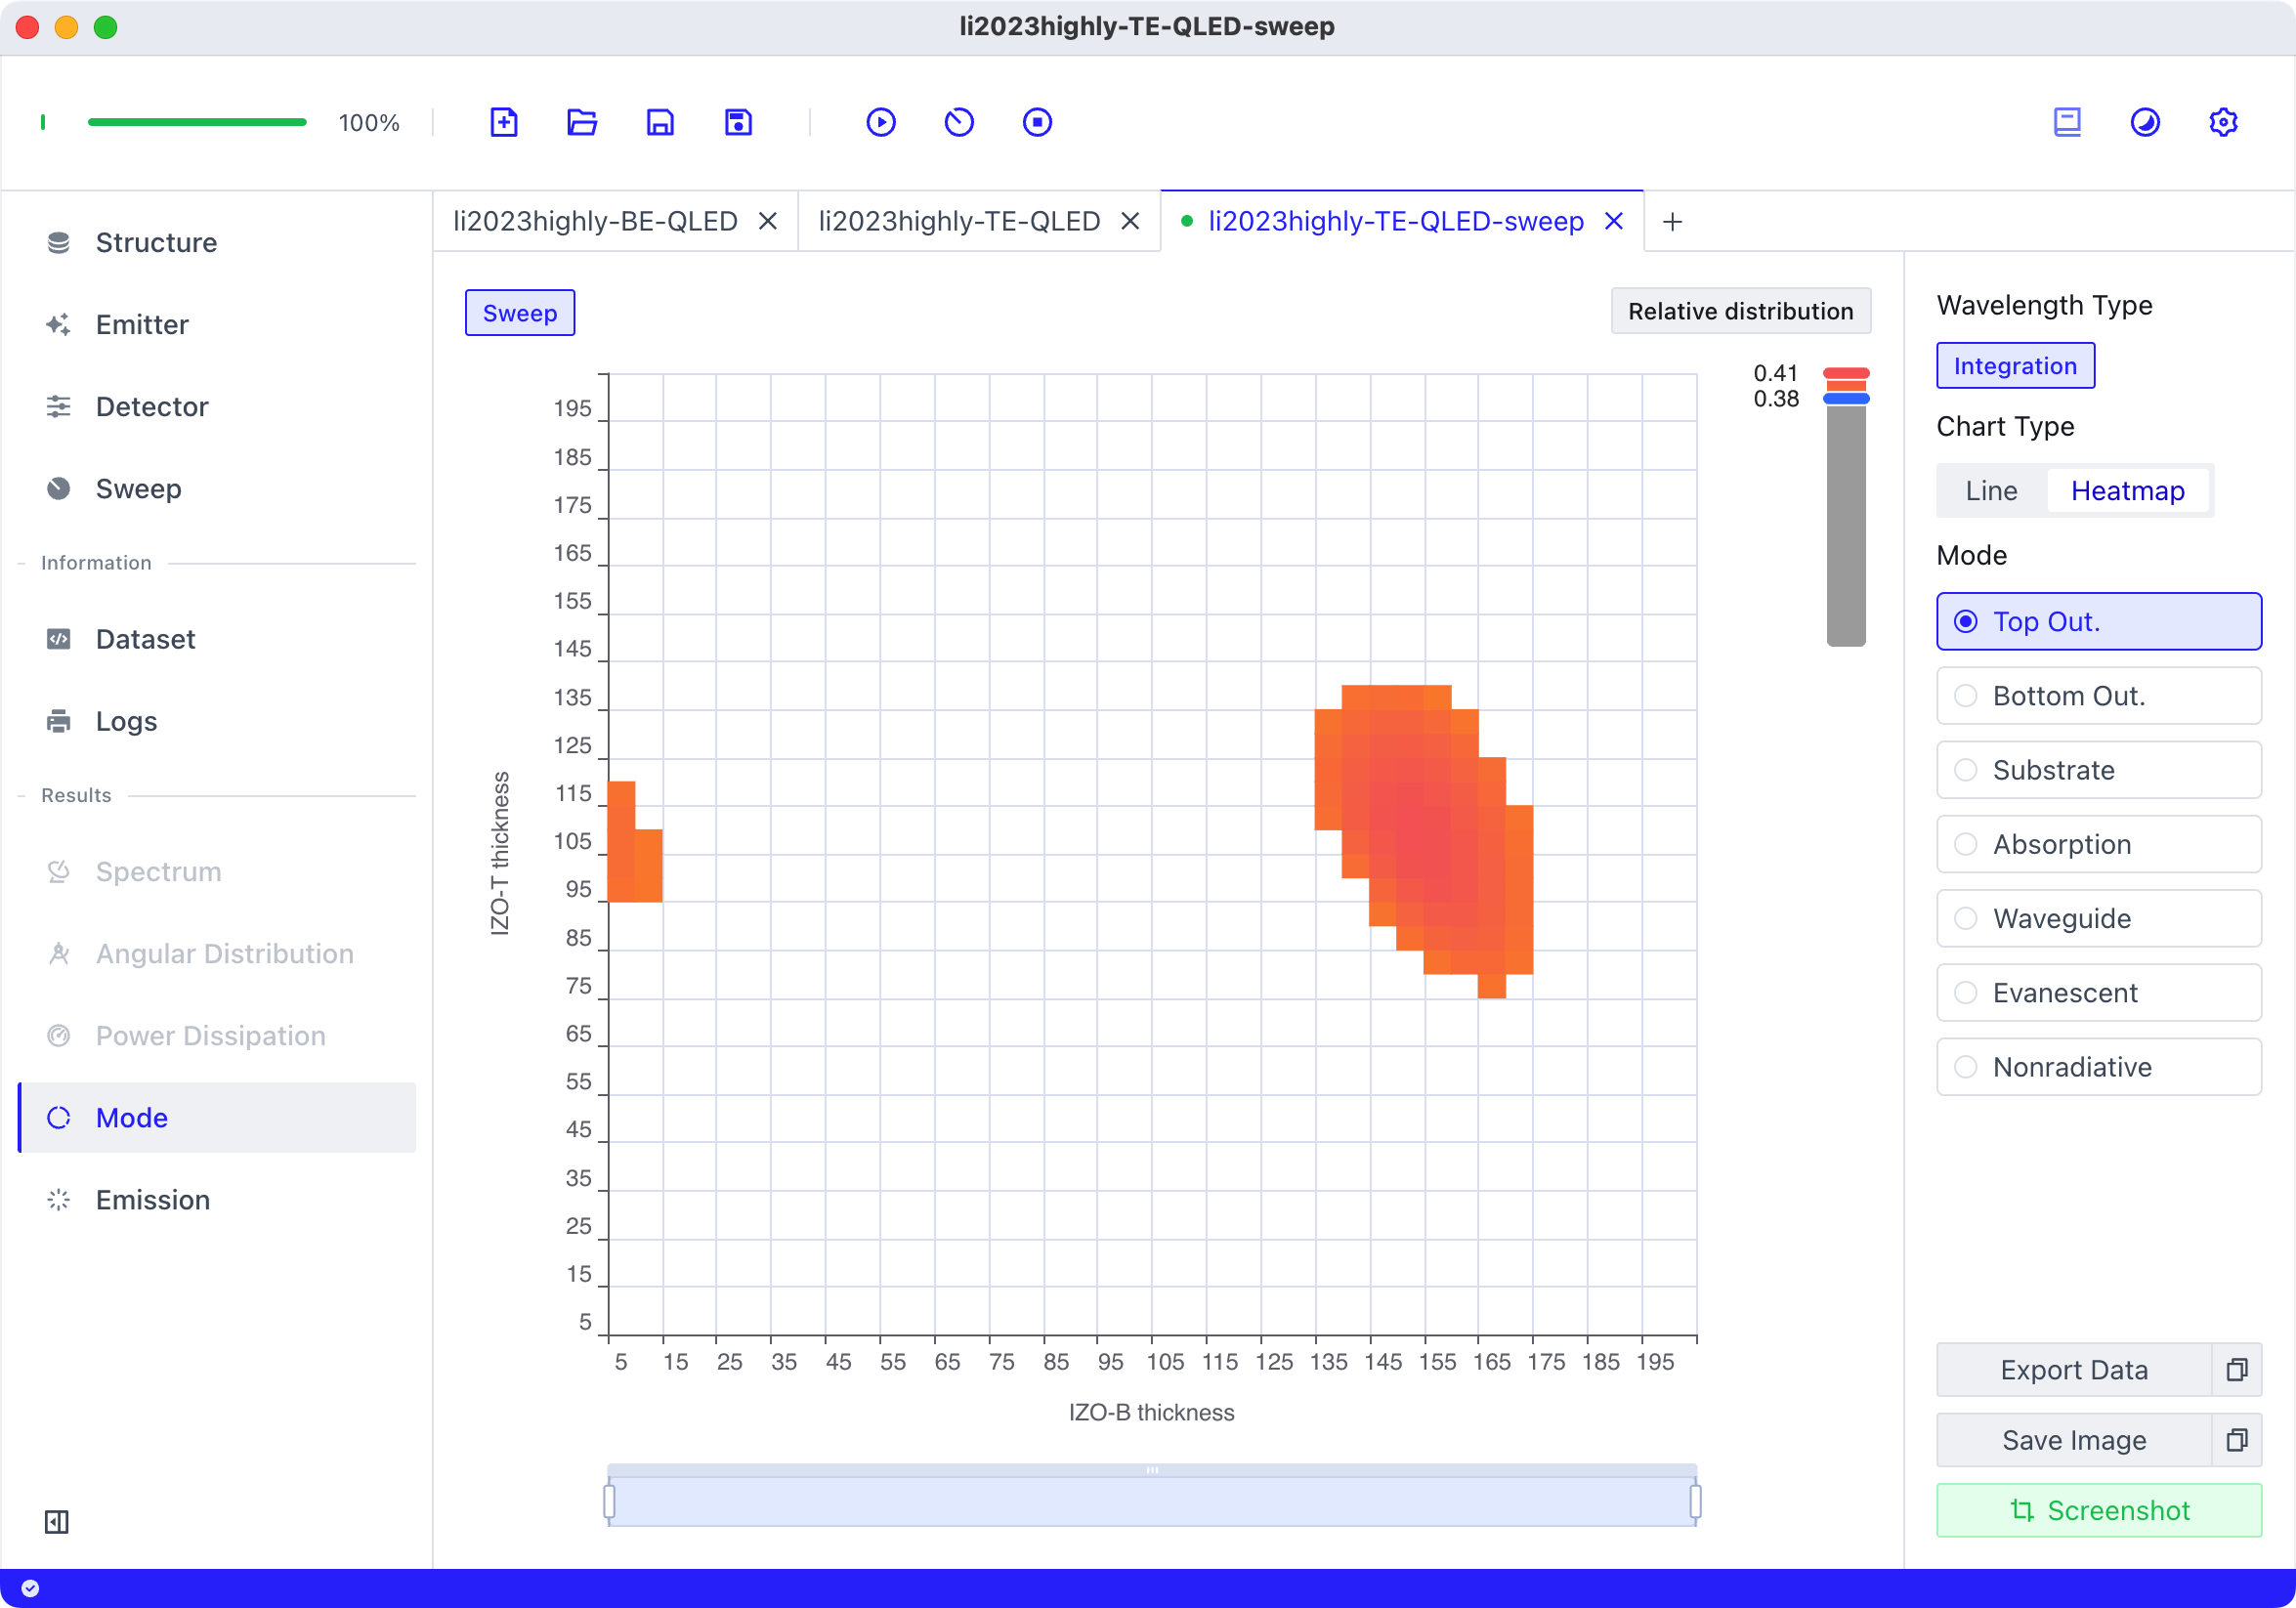
By adjusting the colorbar’s minimum value to 0.38, we can observe that high efficiency can be achieved across a range of IZO thicknesses.
Conclusion
In this case study, we explored the efficiency advantages of TE-QLEDs over BE-QLEDs and demonstrated microcavity optimization techniques for TE-QLEDs, ultimately achieving high efficiency.
Leda’s simulation completed in seconds, and its results closely match those published in the paper. The one-click data export feature facilitates rapid chart creation and data analysis. From modeling to computation to export, Leda effortlessly delivers professional optical simulations with minimal overhead.
Back